
- Litecoin price started a fresh decline from well above $200 against the US Dollar.
- LTC price is now trading below $200 and the 55 simple moving average (4-hours).
- There was a break below a key bullish trend line with support near $200 on the 4-hours chart of the LTC/USD pair (data feed from Coinbase).
- The pair must move above the $188 resistance to start a decent recovery wave in the near term.
Litecoin price is down over 15% from the $232 zone against the US Dollar, similar to bitcoin. LTC price could continue lower if it fails to recover above $188.
Litecoin Price Analysis
This week, there was a nasty decline in bitcoin, ethereum, ripple, and litecoin against the US Dollar. Earlier, LTC gained pace above the $210 resistance level.
The price even broke the $225 resistance and spiked above $230. A high was formed near $232 before the price started a major decline. The price broke the $220 and $210 support levels. There was also a break below a key bullish trend line with support near $200 on the 4-hours chart of the LTC/USD pair.
The pair even broke the $188 support level. It tested the $160 zone and recently corrected higher. It surpassed the 23.6% Fib retracement level of the main decline from the $232 swing high to $161 swing low.
The pair is now trading below $200 and the 55 simple moving average (4-hours). An immediate resistance is near the $185 level. The next key resistance could be $188. The main resistance could be $196 and the 55 simple moving average (4-hours).
The 50% Fib retracement level of the main decline from the $232 swing high to $161 swing low is also near $196. Any more gains could set the pace for a move towards the $220 resistance in the near term. An immediate support is near the $172 level. The next key support is near the $165 level, below which there is a risk of a move towards the $150 level.
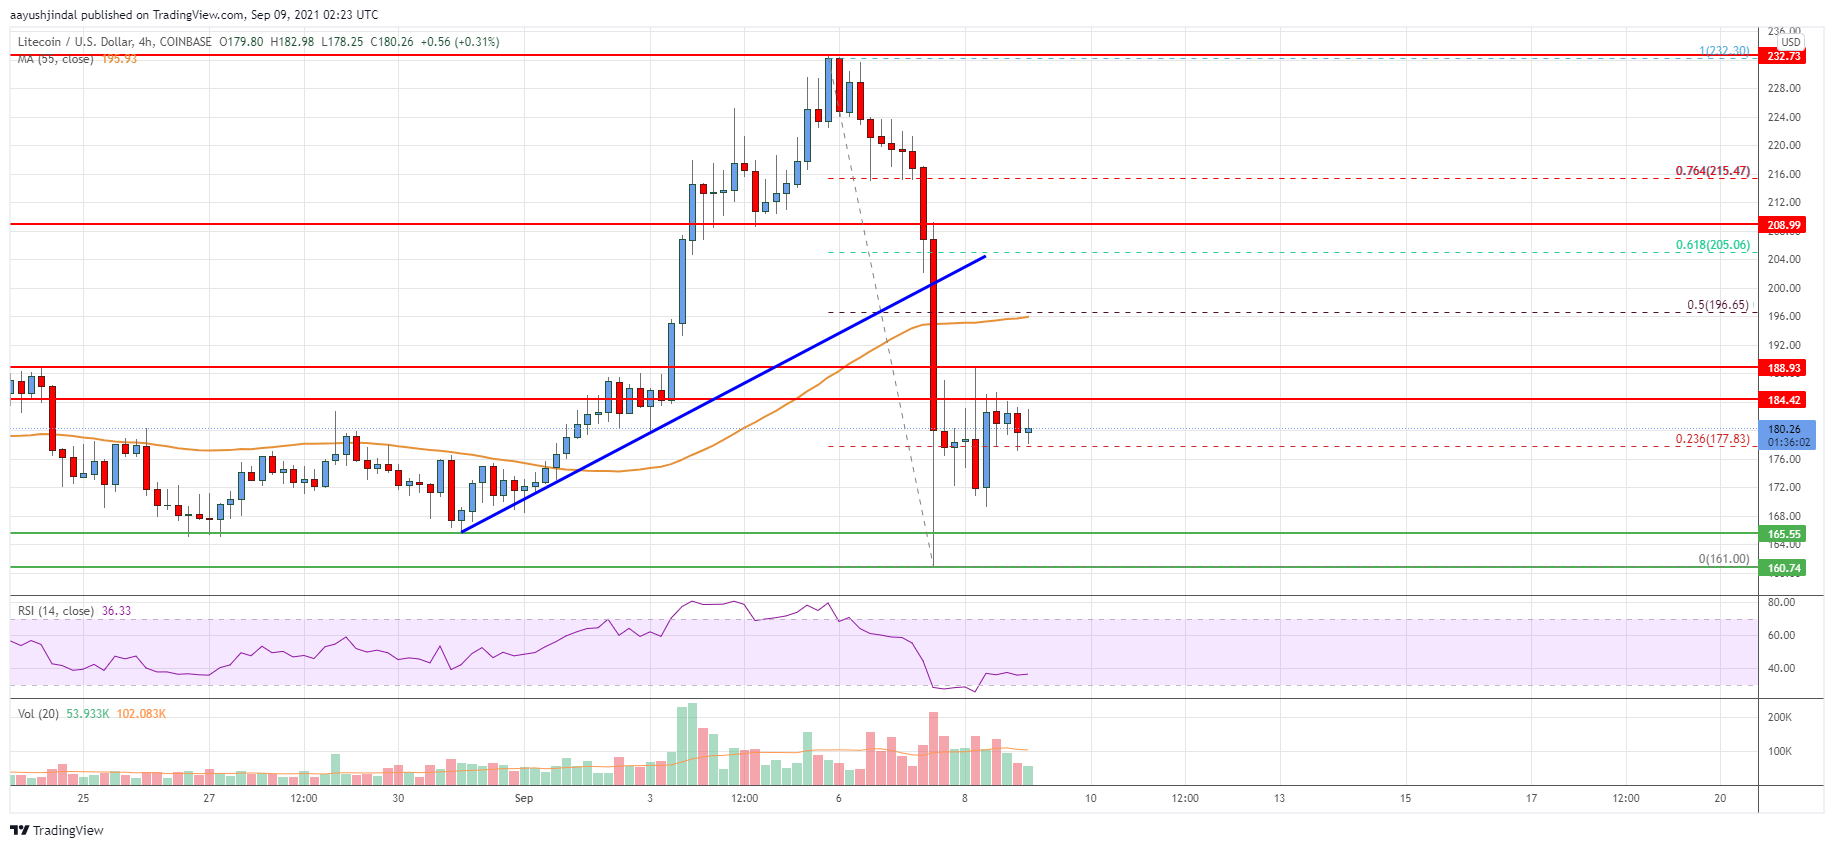
Looking at the chart, litecoin price is clearly trading below $200 and the 55 simple moving average (4-hours). Overall, the price must move above the $188 resistance to start a decent recovery wave in the near term.
Technical indicators
4 hours MACD – The MACD for LTC/USD is now losing pace in the bearish zone.
4 hours RSI (Relative Strength Index) – The RSI for LTC/USD is now below the 50 level.
Key Support Levels – $172 and $165
Key Resistance Levels – $188 and $196.


Leave a Reply
You must be logged in to post a comment.