
- Litecoin price started an upside correction from the $105 support against the US Dollar.
- LTC price is still trading well below $140 and the 55 simple moving average (4-hours).
- There is a major bearish trend line forming with resistance near $140 on the 4-hours chart of the LTC/USD pair (data feed from Coinbase).
- The pair must clear $135 and $140 to start a fresh increase in the near term.
Litecoin price is struggling to gain pace above $130 against the US Dollar, unlike bitcoin. LTC price must break $140 to move into a positive zone in the near term.
Litecoin Price Analysis
This week, there was a decent recovery wave in bitcoin, ethereum, ripple, and litecoin against the US Dollar. Earlier, LTC declined heavily below the $130 level and the 55 simple moving average (4-hours).
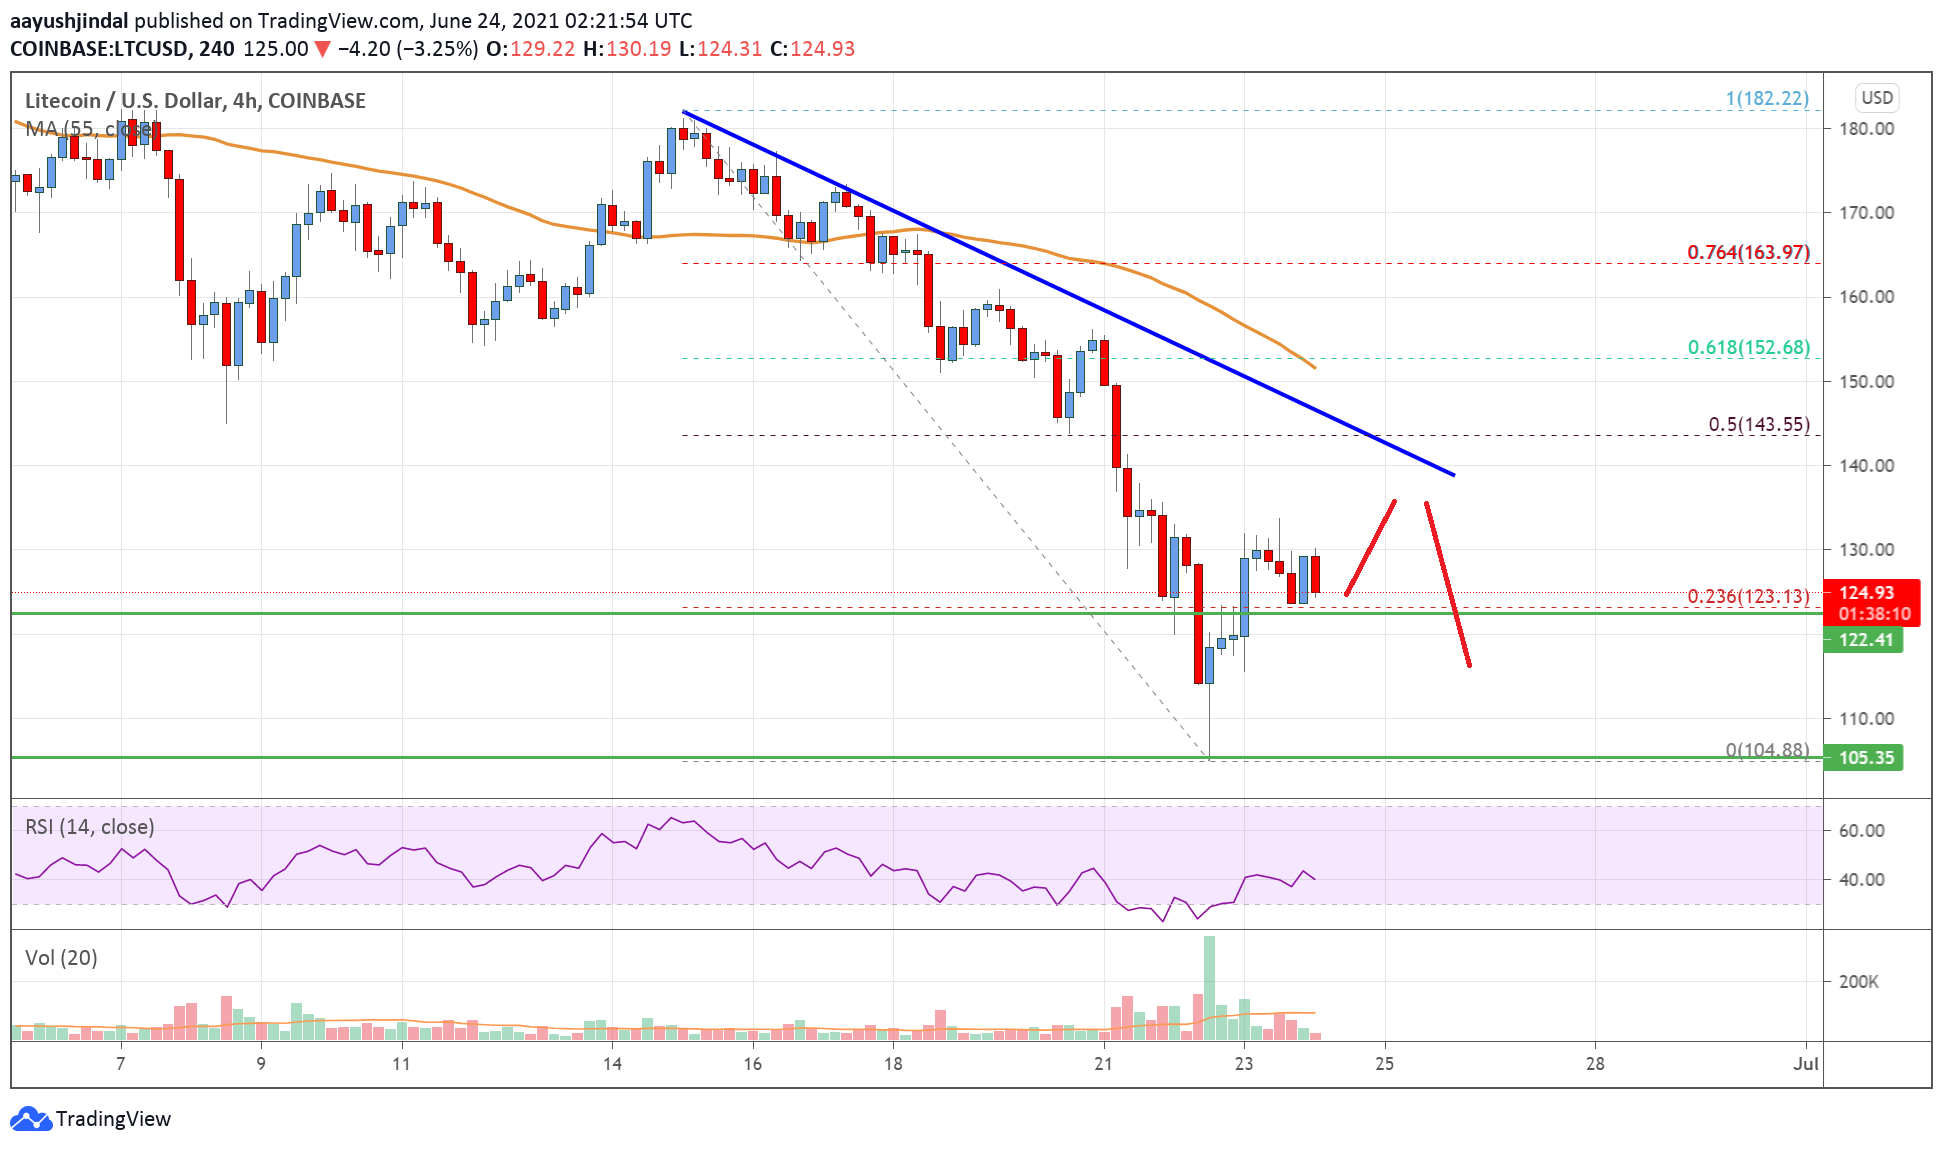
The price even broke the $120 support level. It traded close to the $100 level and a low was formed near $105. Recently, there was an upside correction from $105 and the price climbed above $120. There was a break above the 23.6% Fib retracement level of the key decline from the $182 swing high to $105 low.
However, the price is still trading well below $140 and the 55 simple moving average (4-hours). There is also a major bearish trend line forming with resistance near $140 on the 4-hours chart of the LTC/USD pair.
The trend line is close to the 50% Fib retracement level of the key decline from the $182 swing high to $105 low. Therefore, litecoin price must break the trend line resistance and $140 to move into a positive zone. The next key resistance is near the $150 level and the 55 SMA.
An initial support on the downside is near the $122 level. The next major support could be near the $110 zone. Any more losses might call for a drop towards the $100 level.
Looking at the chart, litecoin price is clearly trading well below $140 and the 55 simple moving average (4-hours). Overall, the price must clear $135 and $140 to start a fresh increase in the near term.
Technical indicators
4 hours MACD – The MACD for LTC/USD is struggling to gain pace in the bullish zone.
4 hours RSI (Relative Strength Index) – The RSI for LTC/USD is still below the 50 level.
Key Support Levels – $122 and $110.
Key Resistance Levels – $135 and $140.


Leave a Reply
You must be logged in to post a comment.