- Ethereum price failed to stay above $2,500 and it extended its decline against the US Dollar.
- ETH price is now trading well below $2,300 and the 55 simple moving average (4-hours).
- There is a major bearish trend line forming with resistance near $2,060 on the 4-hours chart (data feed from Coinbase).
- The pair could correct higher, but it is likely to face resistance near $2,060 and $2,200.
Ethereum price is gaining bearish momentum below $2,200 against the US Dollar. ETH/USD remains at a risk of more downsides unless it reclaims $2,300.
Ethereum Price Analysis
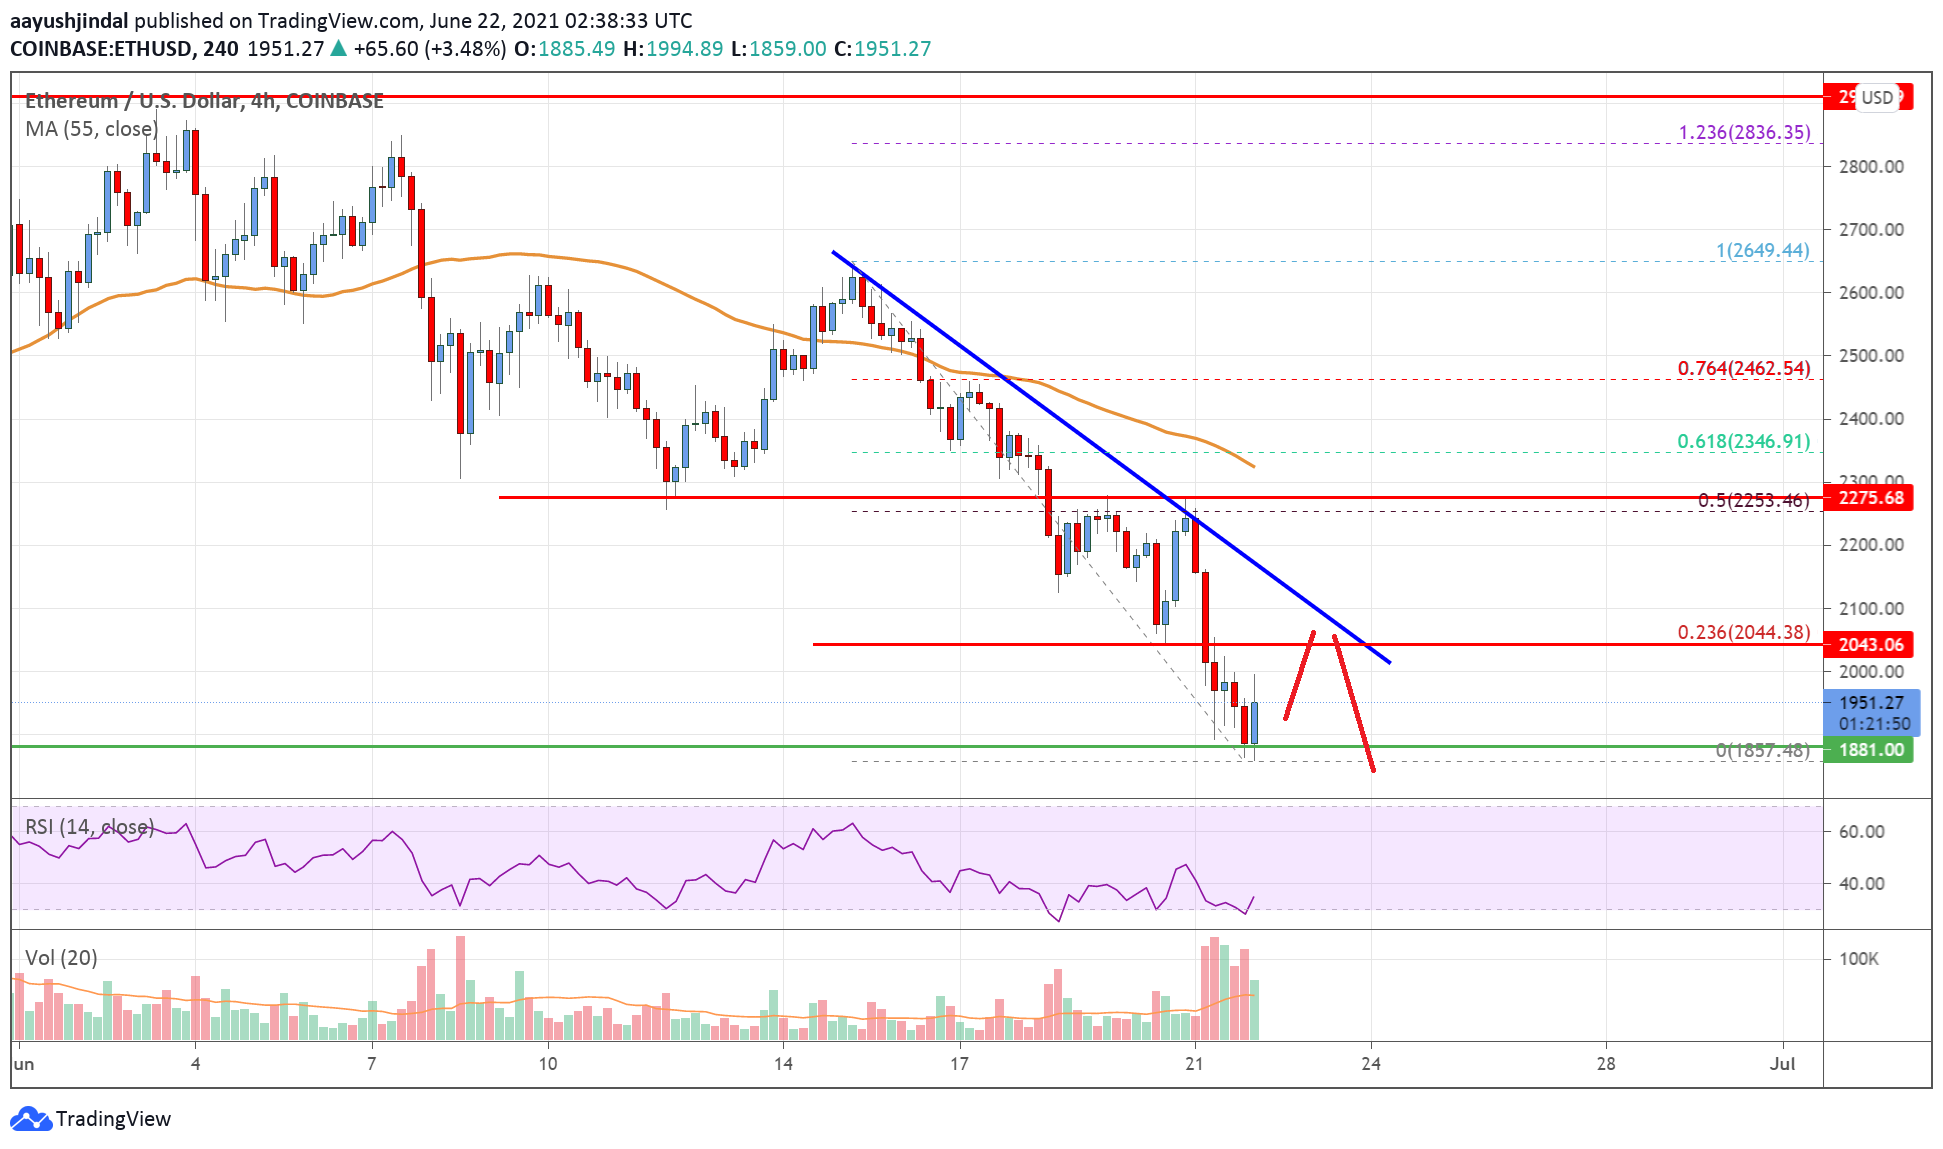
Recently, ethereum failed to stay above the $2,500 support zone against the US Dollar. ETH price extended its decline and it traded below the key $2,200 support zone.
The price even broke the $2,000 support level. It is now trading well below $2,300 and the 55 simple moving average (4-hours). A low is formed near $1,857 and the price is now consolidating losses. An initial resistance on the upside is near the $2,050 level.
It is close to the 23.6% Fib retracement level of the recent decline from the $2,650 swing high to $1,857 low. There is also a major bearish trend line forming with resistance near $2,060 on the 4-hours chart.
On the upside, there is a major hurdle forming near $2,300. It is close to the 50% Fib retracement level of the recent decline from the $2,650 swing high to $1,857 low. A clear break above the $2,300 level and the 100 SMA could open the doors for a strong upward move.
On the downside, an immediate support is near the $1,850 level. The next major support is near the $1,800 level. Any more losses could set the pace for a drop towards the $1,770 support zone in the near term. The next key support for the bulls could be near the $1,500 in the coming sessions.

Looking at the chart, Ethereum price is clearly trading well below the $2,300 zone and the 55 simple moving average (4-hours). Overall, ether price could correct higher, but it is likely to face resistance near $2,060 and $2,200.
Technical indicators
4 hours MACD – The MACD for ETH/USD is gaining momentum in the bearish zone.
4 hours RSI (Relative Strength Index) – The RSI for ETH/USD is now well below the 50 level.
Key Support Levels – $1,850, followed by the $1,500 zone.
Key Resistance Levels – $2,060 and $2,300.


Leave a Reply
You must be logged in to post a comment.