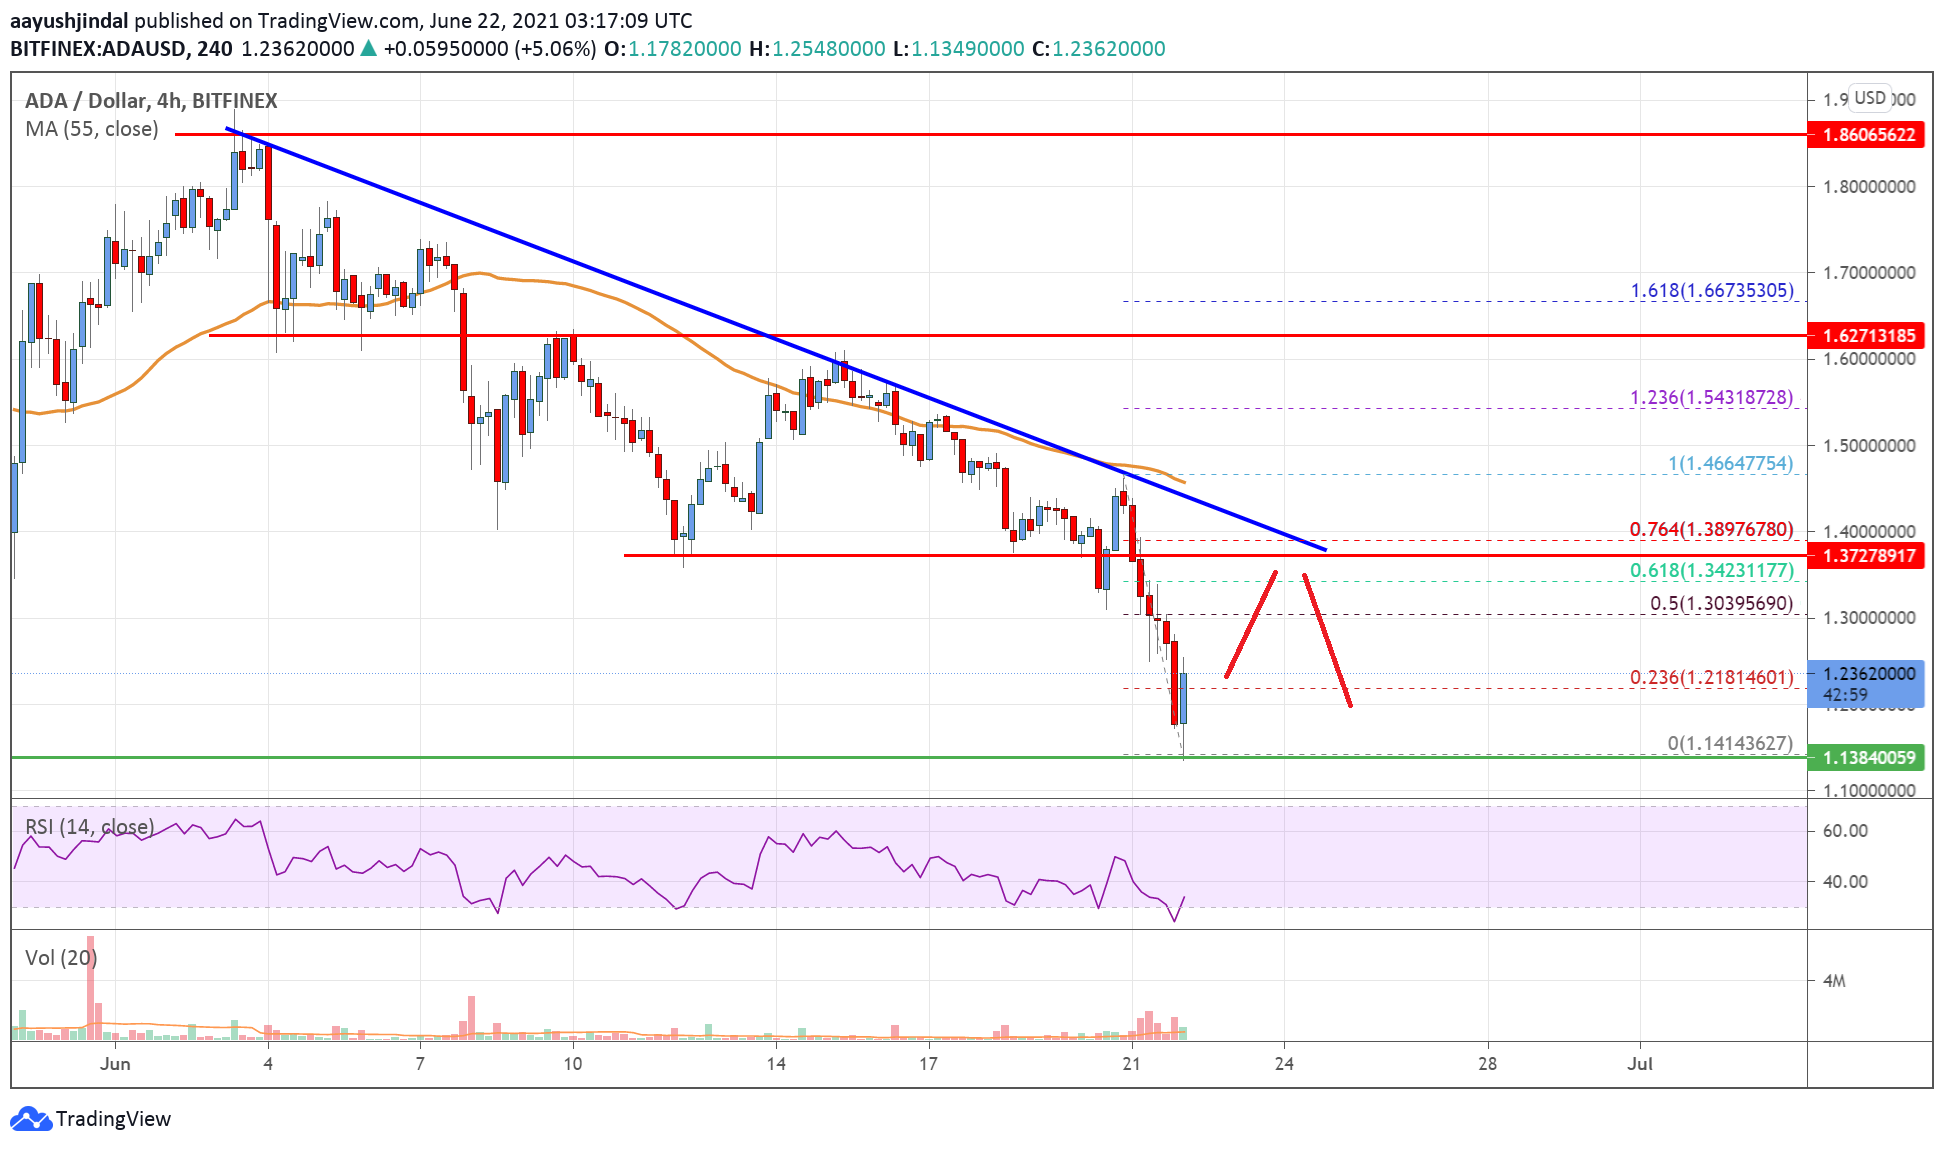
- ADA price started a fresh decline from well above the $1.50 level against the US Dollar.
- The price is now trading well below $1.45 and the 55 simple moving average (4-hours).
- There is a major bearish trend line forming with resistance near $1.38 on the 4-hours chart (data feed via Bitfinex).
- The price is recovering, but it is likely to face sellers near the $1.38 and $1.40 levels.
Cardano price is trading in a bearish zone below $1.40 against the US Dollar, similar to bitcoin. ADA price could continue to move down below $1.20 and $1.15.
Cardano Price Analysis
This week, cardano price followed a bearish path from well above $1.40 against the US Dollar. The ADA/USD pair declined below $1.30 and moved further into a bearish zone.
There was also a break below $1.20 and a close below the 55 simple moving average (4-hours). The price traded as low as $1.141 before it started an upside correction. There was a recovery wave above the $1.20 and $1.22 levels. The price climbed above the 23.6% Fib retracement level of the recent decline from the $1.466 high to $1.14 low.
However, the price is still trading well below $1.45 and the 55 simple moving average (4-hours). An immediate resistance is near the $1.30 level. It is close to the 50% Fib retracement level of the recent decline from the $1.466 high to $1.14 low.
The next major resistance is near the $1.38 level. There is also a major bearish trend line forming with resistance near $1.38 on the 4-hours chart.
A close above the $1.38 and $1.40 levels could open the doors for a steady increase. On the downside, there is a decent support forming near $1.20. The next key support is near the $1.15 level. Any more losses might call for a move towards the $1.10 support zone.

The chart indicates that ADA price is clearly trading well below $1.40 and the 55 simple moving average (4-hours). Overall, the price is recovering, but it is likely to face sellers near the $1.38 and $1.40 levels.
Technical Indicators
4 hours MACD – The MACD for ADA/USD is now gaining pace in the bearish zone.
4 hours RSI – The RSI for ADA/USD is now well below the 50 level.
Key Support Levels – $1.20 and $1.15.
Key Resistance Levels – $1.38 and $1.40.


Leave a Reply
You must be logged in to post a comment.