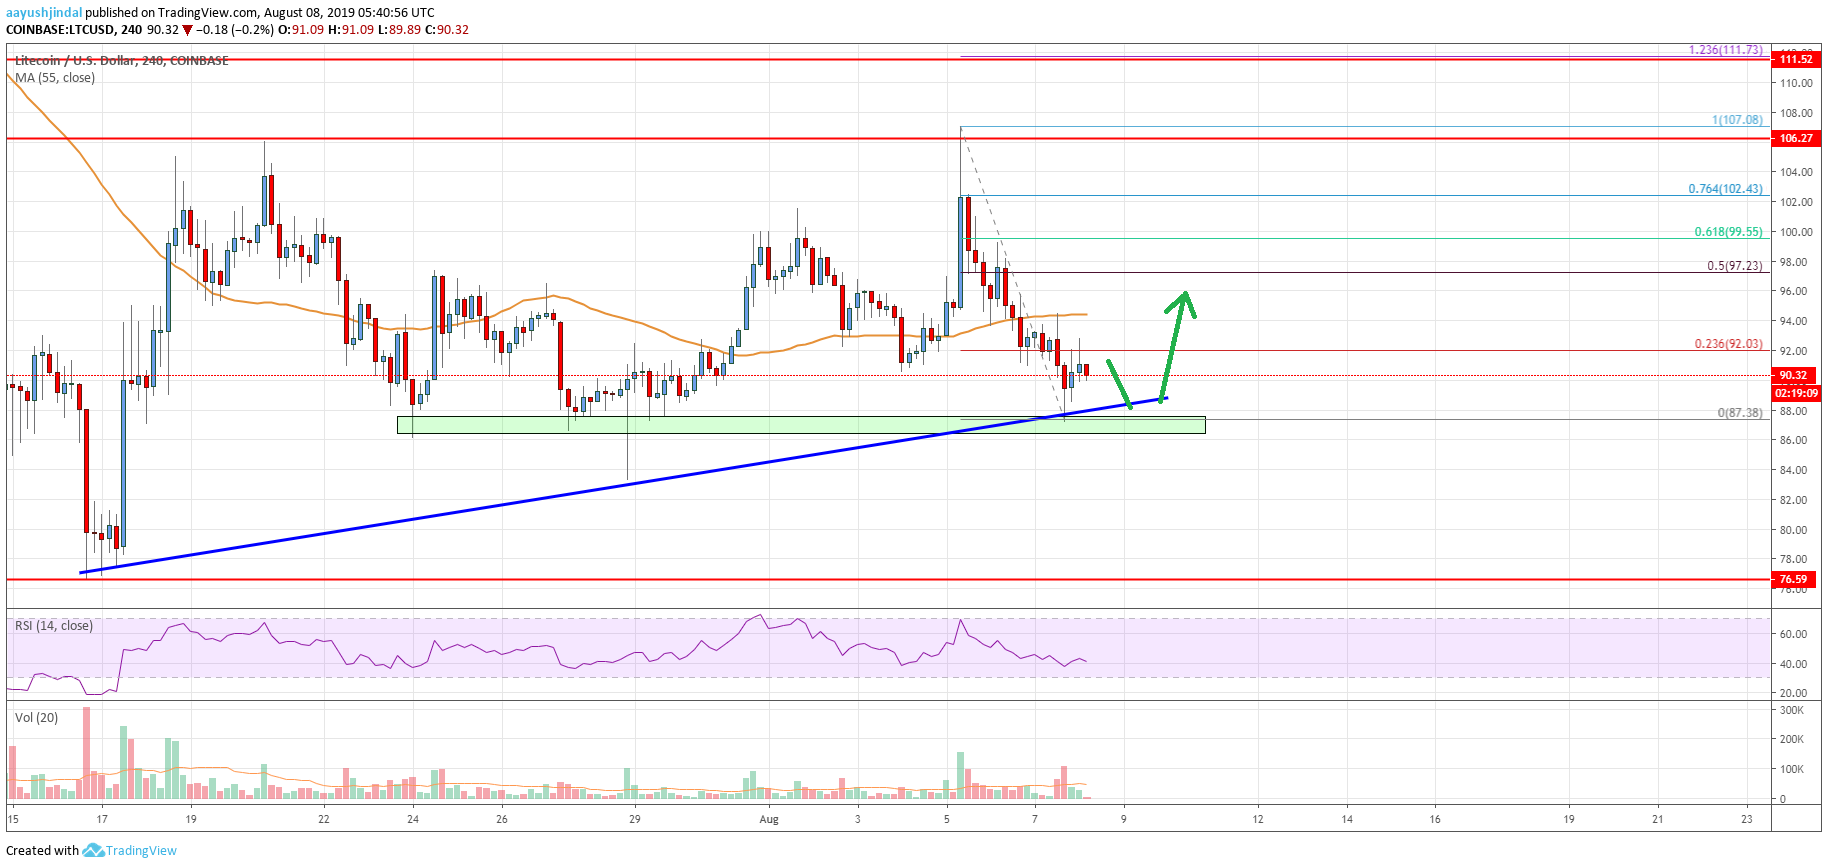
- Litecoin price failed to hold gains above the $100.00 level and declined recently against the US Dollar.
- LTC price is currently holding an important support area near the $87.00 level.
- There is a major bullish trend line forming with support near $88.20 on the 4-hours chart of the LTC/USD pair (data feed from Coinbase).
- The pair is currently consolidating losses and it might correct higher as long as above $87.00.
Litecoin price is struggling to climb higher against the US Dollar and bitcoin, despite halving. LTC price could either recover above $95.00 or extend its decline towards the $76.50 support.
Litecoin Price Analysis
Earlier this week, litecoin price climbed higher sharply above $95.00 and $100.00 against the US Dollar. The LTC/USD pair even broke the $102.00 resistance and settled above the 55 simple moving average (4-hours). However, the pair struggled to stay above the $100.00 level. A swing high was formed near $107.08 and the price trimmed most its gains. It broke the $100.00 and $98.00 levels.
Moreover, the price traded below the $95.00 support and the 55 simple moving average (4-hours). However, the price stayed above the key $87.00 support area. A swing low was formed near $87.38 and the price is currently consolidating losses. An immediate resistance is near the $92.00 level plus the 23.6% Fib retracement level of the recent decline from the $107.08 high to $87.38 low.
The next key resistance is near the $95.00 level and the 55 simple moving average (4-hours). The main resistance is near the $98.00 level. Additionally, the 50% Fib retracement level of the recent decline from the $107.08 high to $87.38 low is also near the $98.00 level. If there is an upside break above $95.00 and $98.00, the price could clear the $100.00 and $102.00 resistance.
On the downside, there is a strong support forming near the $87.00 level. Moreover, there is a major bullish trend line forming with support near $88.20 on the 4-hours chart of the LTC/USD pair. Therefore, a downside break below the trend line and the $87.00 support could start another bearish wave. The next major support is at $80.00, followed by the $76.50 swing low.

Looking at the chart, litecoin price is clearly under pressure below the $95.00 pivot level. Having said that, as long as the price is above the $87.00 support, there are chances of a decent recovery above the $95.00 and $98.00 levels in the near term.
Technical indicators
4 hours MACD – The MACD for LTC/USD is currently losing momentum in the bearish zone.
4 hours RSI (Relative Strength Index) – The RSI for LTC/USD is now well below the 50 level.
Key Support Levels – $87.00 and $80.00.
Key Resistance Levels – $95.00 and $98.00.


Leave a Reply
You must be logged in to post a comment.