- Litecoin started a fresh decline below the $95 zone against the US Dollar.
- LTC price is now trading below $95 and the 55 simple moving average (4 hours).
- There was a break below a key bullish trend line with support near $93 on the 4-hour chart of the LTC/USD pair (data feed from Coinbase).
- The pair is at risk of a downside break below the $90 and $88 support levels.
Litecoin price is struggling below $95 against the US Dollar, similar to Bitcoin. LTC price could continue to decline if it stays below the $88 resistance zone.
Litecoin Price Analysis
In the past 2-3 sessions, there was a fresh decline in Bitcoin, Ethereum, Ripple, and Litecoin against the US Dollar. Earlier, LTC started a decent increase above the $95 and $100 resistance levels.
However, the bears were active near the $103.50 zone. A high is formed near $103.42 and the price started a major decline. There was a sharp move below the $100 and $95 levels. Besides, there was a break below a key bullish trend line with support near $93 on the 4-hour chart of the LTC/USD pair.
The price even spiked below the $90 level. A low is formed near $87.04 and the price is now consolidating losses. The price is now testing the 23.6% Fib retracement level of the downward move from the $103.42 swing high to the $87.04 low.
On the upside, the price is facing resistance near the $92 zone. The next major resistance sits near the $95 level. It is near the 50% Fib retracement level of the downward move from the $103.42 swing high to the $87.04 low.
The main resistance is near the $100 level. A clear move above the $100 level could pump the price toward the $103 level or even $105. The next major resistance could be $115.
On the downside, immediate support is near the $89.20 level. The next key support is near the $87 level. If there is a downside break below the $87 support, the price could accelerate lower toward the $80 level in the near term.
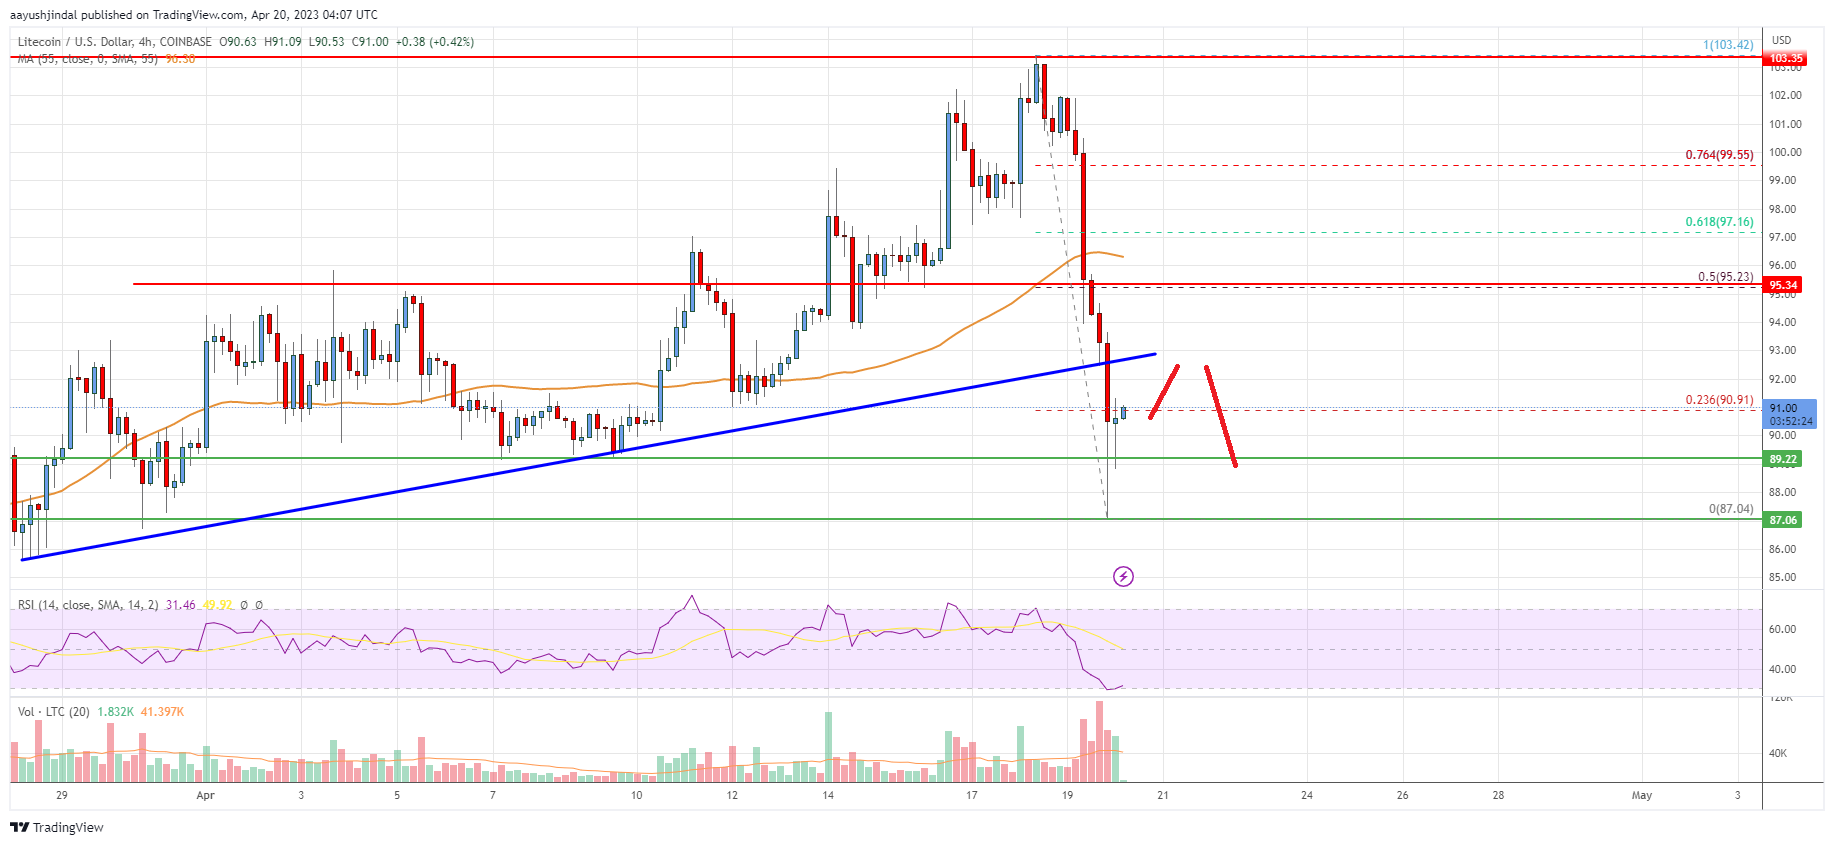
Looking at the chart, Litecoin price is clearly trading below $95 and the 55 simple moving average (4 hours). Overall, the price is at risk of a downside break below the $90 and $88 support levels.
Technical indicators
4 hours MACD – The MACD for LTC/USD is now gaining pace in the bearish zone.
4 hours RSI (Relative Strength Index) – The RSI for LTC/USD is now below the 50 level.
Key Support Levels – $89.20 and $87.00.
Key Resistance Levels – $92.00 and $95.00.
