
- Litecoin price rallied above the $44.00 and $46.20 resistance levels against the US Dollar.
- LTC price is currently correcting lower and it traded below the $46.20 level.
- There was a break below a key bullish trend line with support near $45.40 on the 4-hours chart of the LTC/USD pair (data feed from Coinbase).
- The pair is likely to find a strong buying interest near the $44.00 support area.
Litecoin price is correcting gains from the $48.62 high against the US Dollar, similar to bitcoin. LTC price is likely to bounce back as long as it is above $44.00.
Litecoin Price Analysis
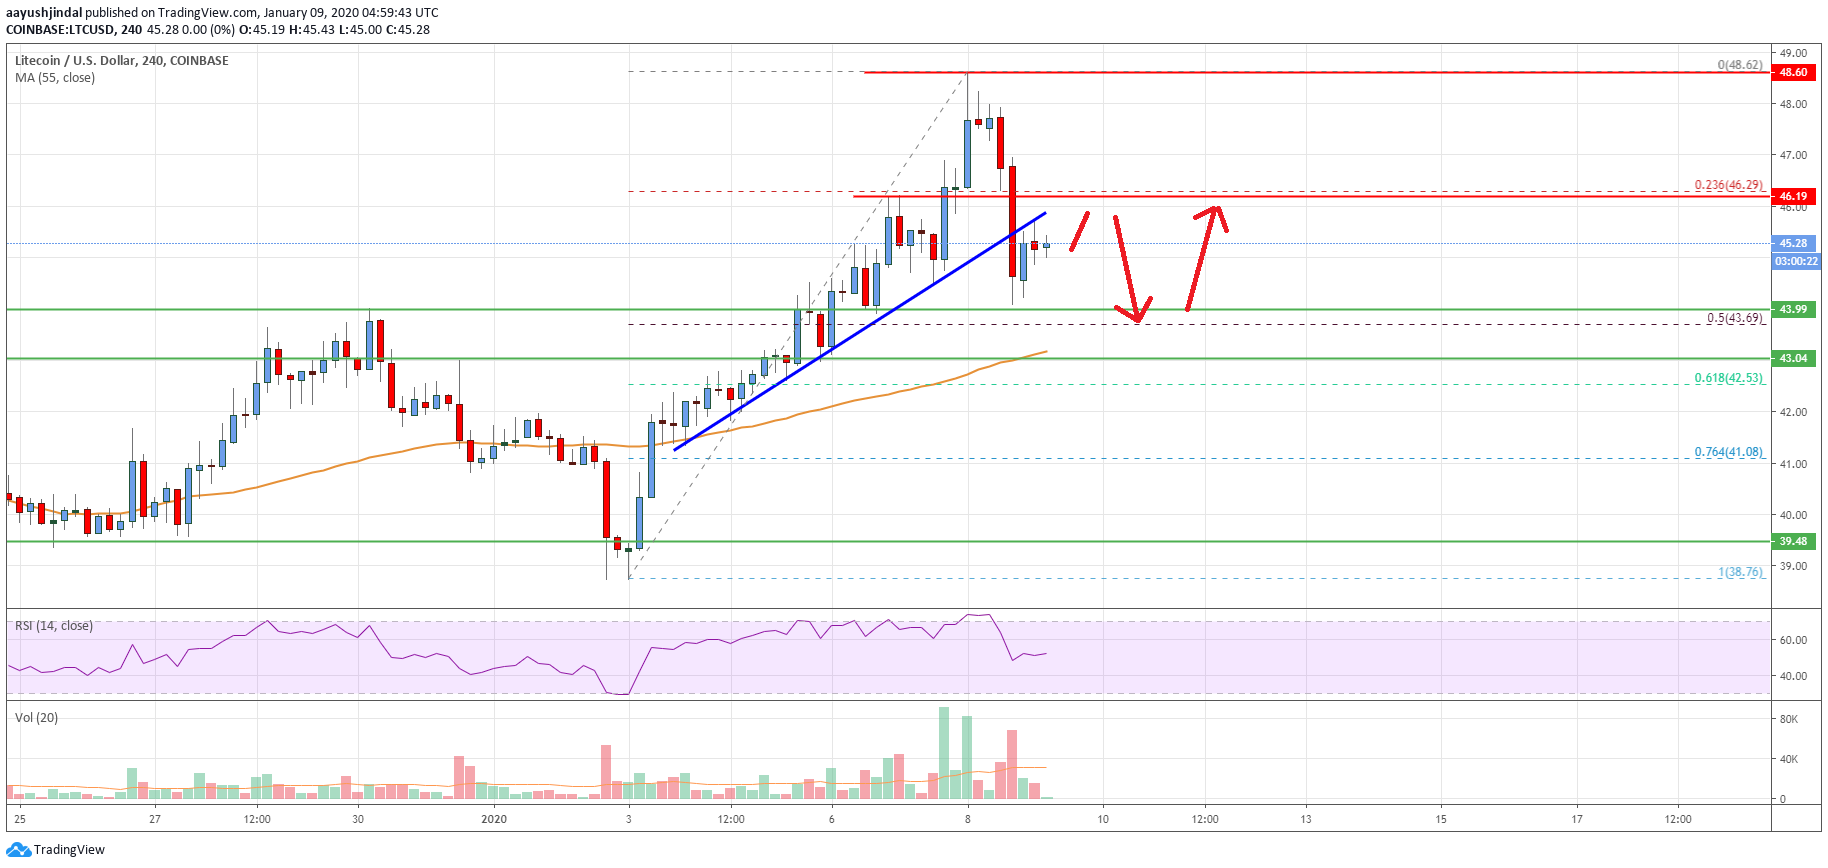
After a strong rise, bitcoin, Ethereum ripple and litecoin started a downside correction against the US Dollar. LTC price formed a new 2020 high at $48.62 level before it trimmed its gains.
There was a break below the $46.20 support level. Besides, the price traded below the 23.6% Fib retracement level of the upward wave from the $38.76 low to $48.62 high.
More importantly, there was a break below a key bullish trend line with support near $45.40 on the 4-hours chart of the LTC/USD pair. It opened the doors for more losses below the $45.00 support area.
Litecoin price traded close to the key $44.00 support area. Moreover, the 50% Fib retracement level of the upward wave from the $38.76 low to $48.62 high is also near the $43.70 level to provide support.
The next major support is near the $43.00 area since it is close to the 55 simple moving average (4-hours). If there is a downside break below the $43.00 support, the price is likely to move into a bearish zone.
On the upside, an initial resistance is near the $46.00 level and the broken trend line. The first key resistance is near the $46.20 level, above which there are chances of a decent increase.
The next major hurdle is near the $48.60 level, above which the bulls are likely to aim an upside break above the main $50.00 resistance level in the near term.
Looking at the chart, litecoin price is clearly correcting lower below the $46.20 support. However, there are many supports near $44.00 and $43.00. Therefore, the price is likely to bounce back as long as it is above $43.00.
Technical indicators
4 hours MACD – The MACD for LTC/USD is slowly losing momentum in the bearish zone.
4 hours RSI (Relative Strength Index) – The RSI for LTC/USD is currently near the 50 level.
Key Support Levels – $44.00 and $43.00.
Key Resistance Levels – $46.20 and $48.60.


Leave a Reply
You must be logged in to post a comment.