- Litecoin price started an upside correction from the $145 swing low against the US Dollar.
- LTC price is still trading well below $180 and the 55 simple moving average (4-hours).
- There is a major bearish trend line forming with resistance near $182 on the 4-hours chart of the LTC/USD pair (data feed from Coinbase).
- The pair could fail to clear the $180 resistance and start a fresh decline in the near term.
Litecoin price is struggling to clear $180 and $185 against the US Dollar, while bitcoin climbed 10%. LTC price must break $180 to kickstart a strong increase in the near term.
Litecoin Price Analysis
This week, there was another drop in bitcoin, ethereum, ripple, and litecoin against the US Dollar. LTC broke the $155 and $150 support levels. However, it found support near the $145 zone.
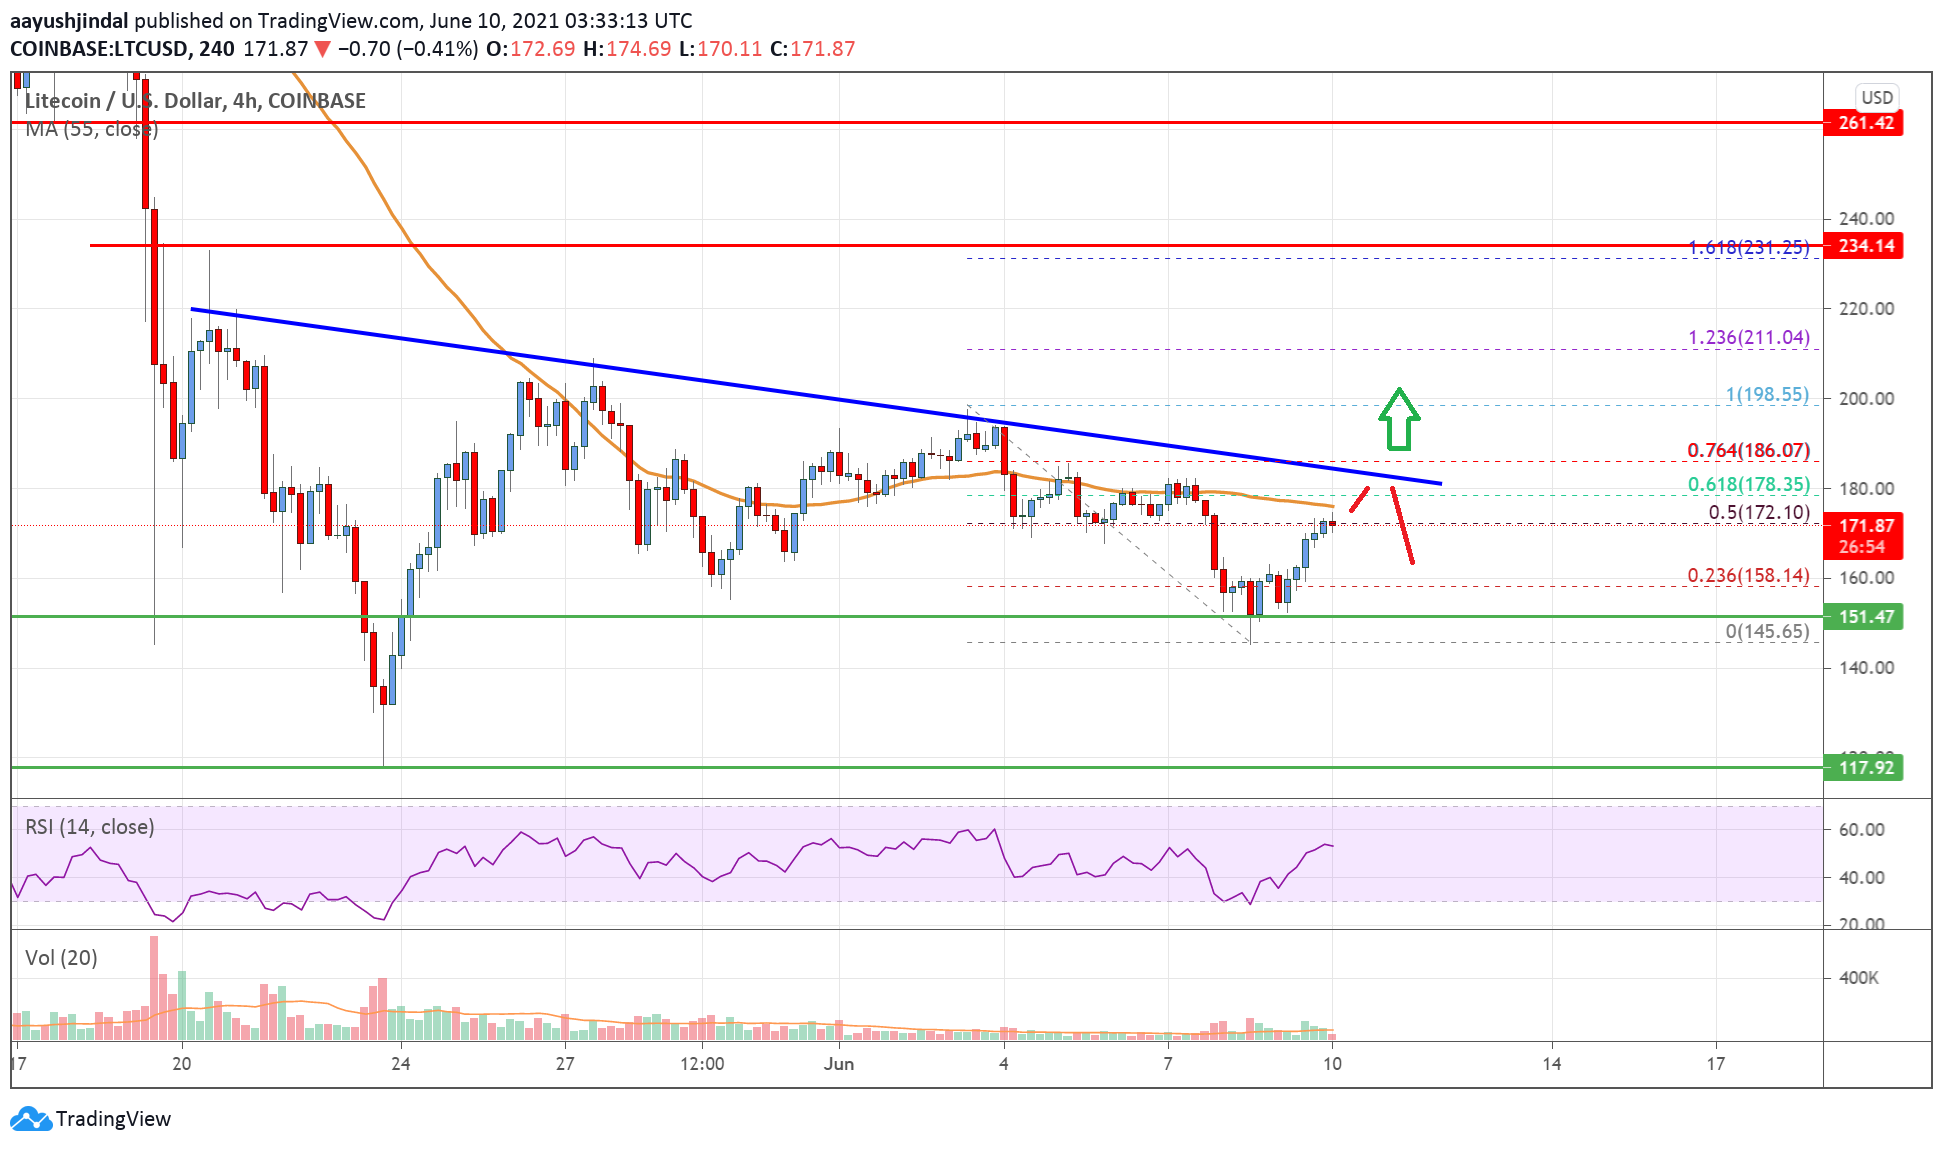
Recently, the price started a decent recovery wave from the $145 swing low. It broke the $155 and $165 resistance levels. There was also a break above the 23.6% Fib retracement level of the key decline from the $198 swing high to $145 low.
It is now testing the $172 resistance. The 50% Fib retracement level of the key decline from the $198 swing high to $145 low is also acting as a resistance. Besides, it is still trading well below $180 and the 55 simple moving average (4-hours).
There is also a bearish trend line forming with resistance near $182 on the 4-hours chart of the LTC/USD pair. A clear upside break above the $180 and $182 levels is must for a sustained upward move in the near term. The next major resistance is near the $200 level.
An initial support on the downside is near the $165 level. The next major support could be near the $150 zone. Any more losses might call for a drop towards the $130 level.

Looking at the chart, litecoin price is still struggling below $180 and the 55 simple moving average (4-hours). Overall, the price could fail to clear the $180 resistance and start a fresh decline in the near term.
Technical indicators
4 hours MACD – The MACD for LTC/USD is slowly gaining pace in the bullish zone.
4 hours RSI (Relative Strength Index) – The RSI for LTC/USD is now back above the 50 level.
Key Support Levels – $155 and $150.
Key Resistance Levels – $180 and $200.


Leave a Reply
You must be logged in to post a comment.