
- Litecoin price is currently consolidating losses above the $45.00 and $46.00 support levels against the US Dollar.
- LTC price is currently testing the $49.20 resistance level and it is well below the 55 simple moving average (4-hours).
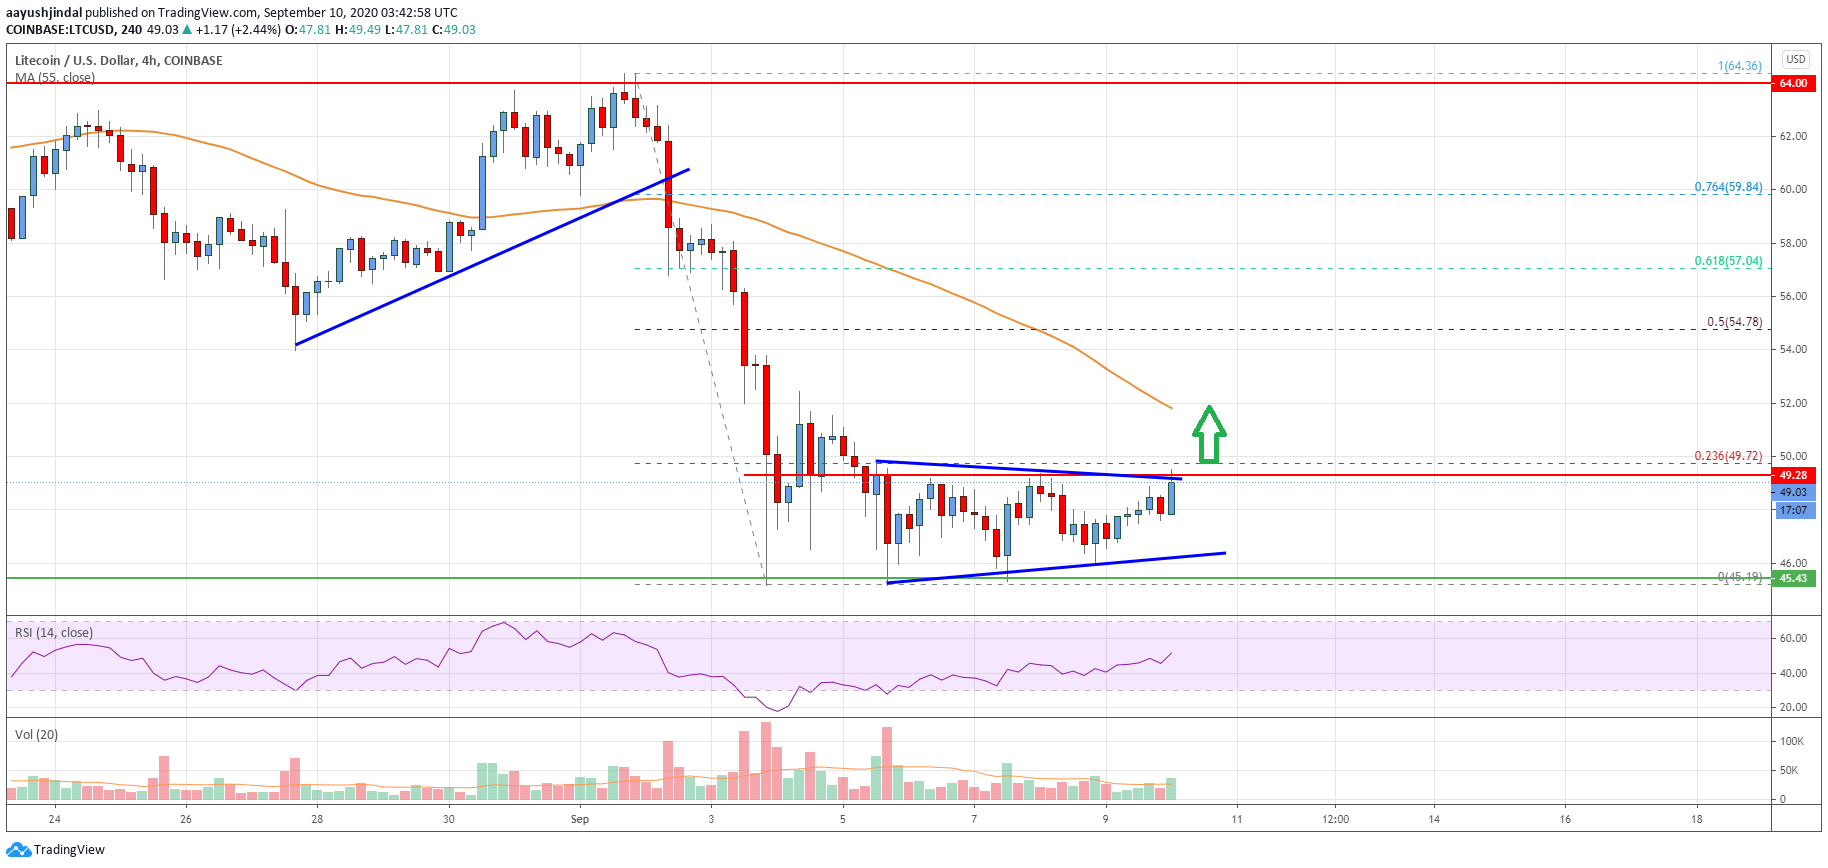
- There is a key contracting triangle forming with resistance near $49.25 on the 4-hours chart of the LTC/USD pair (data feed from Coinbase).
- The pair must break the $49.50 and $50.00 resistance levels to move into a positive zone.
Litecoin price is currently consolidating losses above the $45.00 support against the US Dollar, similar to bitcoin. LTC price is likely to accelerate higher if it clears $50.00.
Litecoin Price Analysis
In the past two sessions, there were mostly range moves in bitcoin, Ethereum, ripple, and litecoin against the US Dollar. Earlier, LTC price declined heavily below the $55.00 support level and the 55 simple moving average (4-hours).
The decline gained pace below the $50.00 support and it traded to a new multi-week low at $45.19. Recently, the price started consolidating losses above the $45.00 and $46.00 support levels.
It is currently testing the $49.20 resistance level. The stated resistance coincides with the 23.6% Fib retracement level of the downward move from the $64.36 high to $45.19 low. There is also a key contracting triangle forming with resistance near $49.25 on the 4-hours chart of the LTC/USD pair.
If there is an upside break above the triangle resistance at $49.50, the price could surge above the $50.00 resistance zone. The next major resistance is near the $52.00 level and the 55 simple moving average (4-hours).
Any further gains could lead the price towards the $54.75 and $55.00 resistance levels. The 50% Fib retracement level of the downward move from the $64.36 high to $45.19 low is also near the $54.78 level to act as a hurdle.
Conversely, the price might fail to surpass the $49.50 and $50.00 resistance levels. An initial support is near the $47.50 level. The main support is near the triangle lower trend line and the $46.00 level. A clear close below $46.00 may perhaps open the doors for a push towards the $40.00 support.
Looking at the chart, litecoin price is clearly approaching the next major break near the $50.00 level. Overall, the price must break the $49.50 and $50.00 resistance levels to move into a positive zone in the near term.
Technical indicators
4 hours MACD – The MACD for LTC/USD is currently gaining momentum in the bullish zone.
4 hours RSI (Relative Strength Index) – The RSI for LTC/USD is currently just above the 50 level.
Key Support Levels – $47.50 and $46.00.
Key Resistance Levels – $49.50 and $50.00.


Leave a Reply
You must be logged in to post a comment.