- Litecoin price started an upside correction after forming a base above $52.50 against the US Dollar.
- LTC price is currently consolidating above the $57.50 level and it could slowly climb higher.
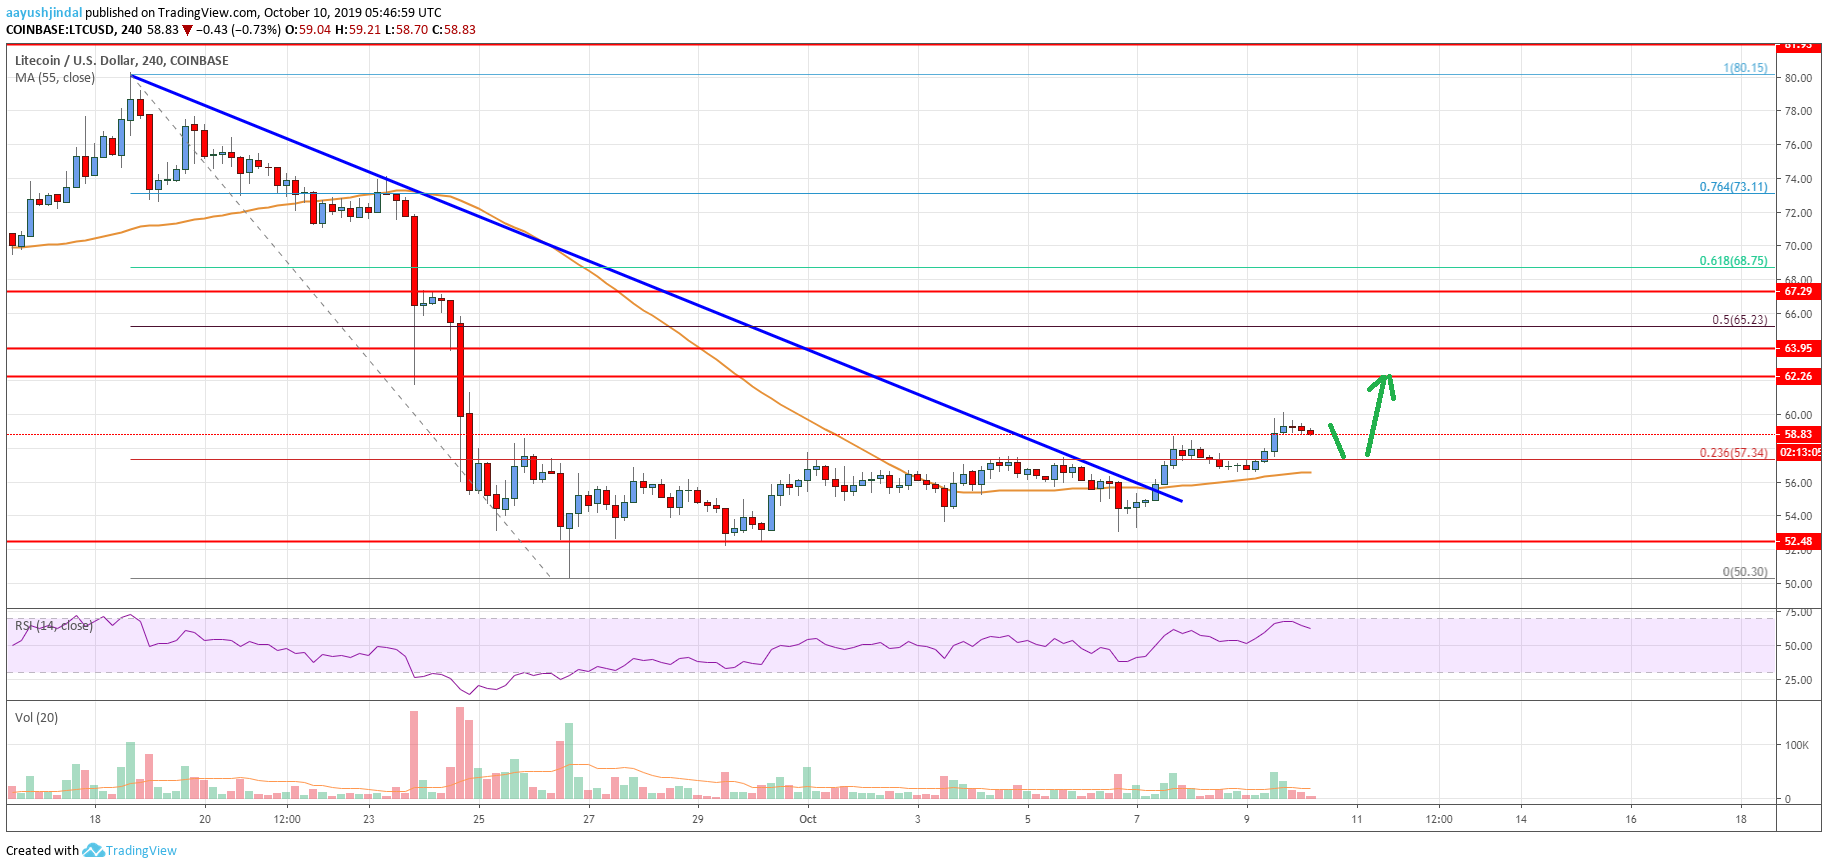
- There was a break above a key bearish trend line with resistance near $55.50 on the 4-hours chart of the LTC/USD pair (data feed from Coinbase).
- The pair could dip a few points, but it is likely to climb towards the $62.50 and $64.00 resistances.
Litecoin price is showing a few positive signs against the US Dollar, while bitcoin is rising. LTC price could face a strong resistance near $64.00 if it climbs higher.
Litecoin Price Analysis
This past week, litecoin price corrected below the $56.00 level against the US Dollar. The LTC/USD pair even broke the $55.00 support and the 55 simple moving average (4-hours). However, the pair remained well supported above the $52.50 level. A swing low was formed near $53.00 and the price recently started a fresh increase. It broke the $55.00 and $56.50 resistance levels.
Additionally, there was a close above the $56.50 level and the 55 simple moving average (4-hours). More importantly, there was a break above a key bearish trend line with resistance near $55.50 on the 4-hours chart of the LTC/USD pair. The pair is now trading above the 23.6% Fib retracement level of the last major drop from the $80.15 high to $50.30 low.
At the moment, the $60.00 level seems to be acting as a resistance and the price is consolidating gains. On the downside an immediate support is near the $57.50 level. The main support is near the $56.50 level and the 55 simple moving average (4-hours). If there is a downside break below the $56.50 support, the price could move back into a bearish zone towards $52.50.
On the upside, a break above the $60.00 resistance could push the price towards the $62.50 resistance area. The next key resistance is near the $64.00 level, above which the price might test the $65.20 level. It represents the 50% Fib retracement level of the last major drop from the $80.15 high to $50.30 low.

Looking at the chart, litecoin price is consolidating above the $57.00 and $56.50 support levels. On the upside, the price must surpass $60.00 and $62.50 for a decent increase. However, it won’t be easy for the bulls to push the price above $64.00 and $65.20.
Technical indicators
4 hours MACD – The MACD for LTC/USD is struggling to gain momentum in the bullish zone.
4 hours RSI (Relative Strength Index) – The RSI for LTC/USD is currently correcting lower towards the 60 level.
Key Support Levels – $56.50 and $52.50.
Key Resistance Levels – $60.00 and $62.50.


Leave a Reply
You must be logged in to post a comment.