
- Litecoin price is down more than 5% today and it broke the key $51.20 support against the US Dollar.
- LTC price is correcting currently higher and it could face resistance near $50.00 and $51.20.
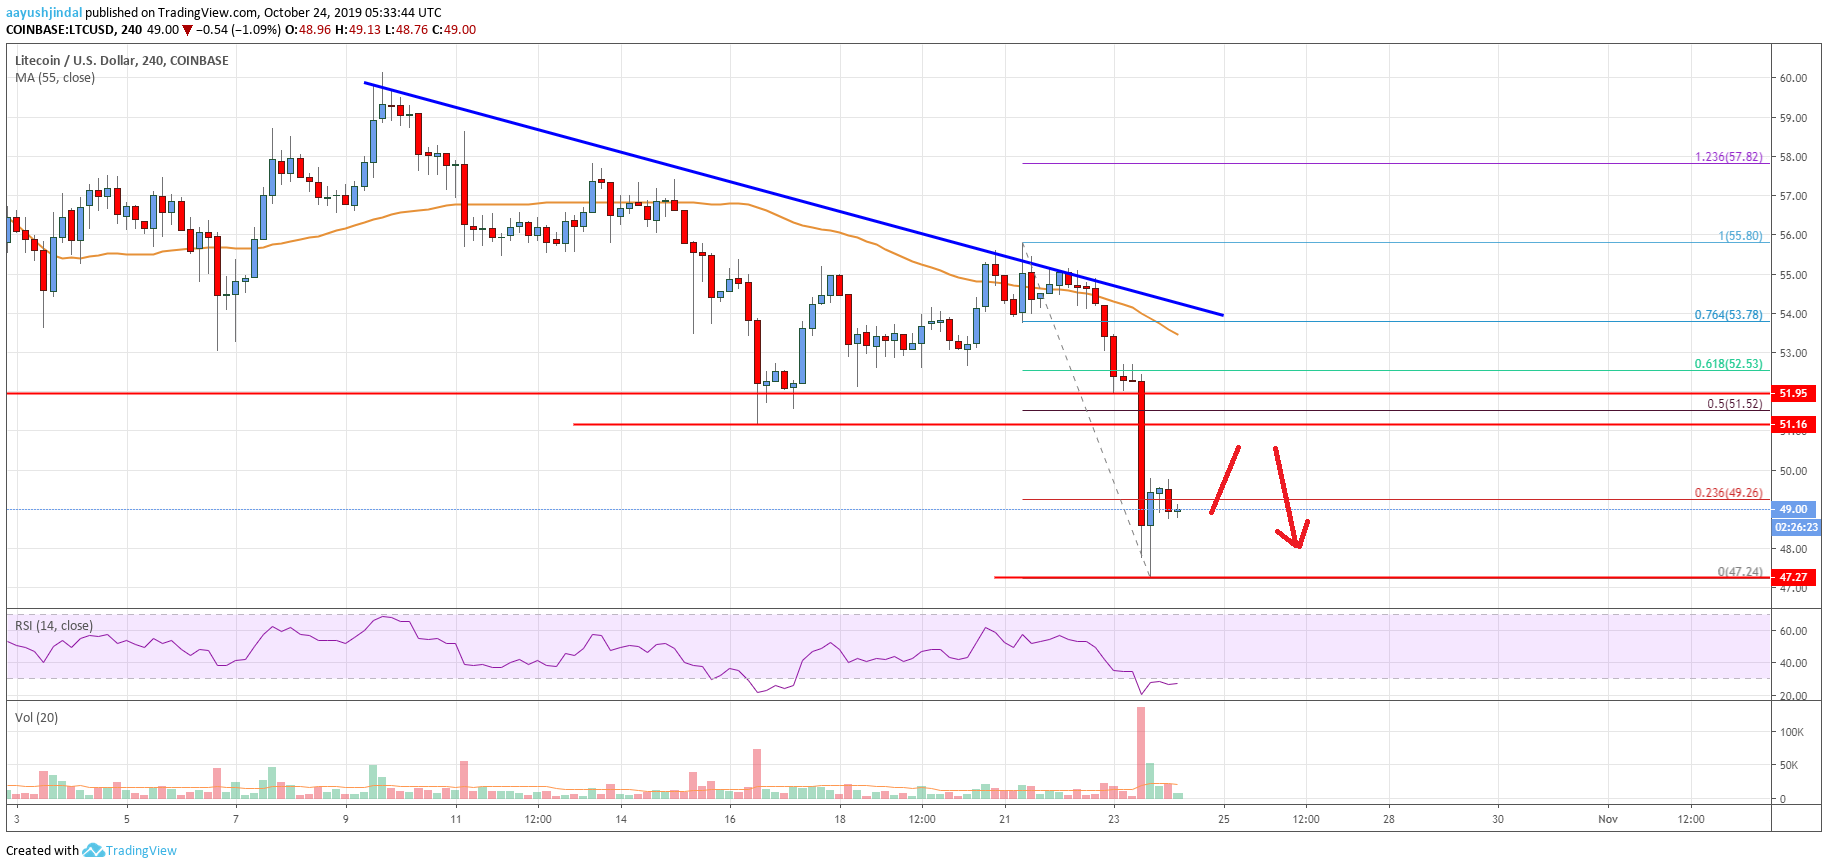
- There is a crucial bearish trend line forming with resistance near $53.75 on the 4-hours chart of the LTC/USD pair (data feed from Coinbase).
- The pair remains at a risk of more downsides if it fails to recover above $50.00 and $51.20.
Litecoin price is back in a downtrend below $52.00 against the US Dollar, similar to bitcoin. LTC price could correct higher, but the previous support near $52.00 might prevent upsides.
Litecoin Price Analysis
Recently, there was a sharp decline in bitcoin, Ethereum, ripple and litecoin against the US Dollar. Earlier, LTC price made an attempt to break the $56.00 resistance area, but it failed and started a fresh decline.
There was a break below the $54.00 support area and the 55 simple moving average (4-hours). Moreover, the price traded below a few important supports near the $52.00 and $51.20 levels.
Finally, there was a break below the $50.00 handle and the price traded to a new monthly low at $47.24. It is currently consolidating losses above the $48.00 level. Litecoin was able to recover above the 23.6% Fib retracement level of the recent decline from the $55.80 high to $47.24 low.
An immediate resistance on the upside is near the $50.00 level. However, the main resistance is near the $51.20 and $52.00 levels. Additionally, the 50% Fib retracement level of the recent decline from the $55.80 high to $47.24 low is near the $51.50.
More importantly, there is a crucial bearish trend line forming with resistance near $53.75 on the 4-hours chart of the LTC/USD pair. Therefore, there are many hurdles for the bulls if the price corrects above the $50.00 level.
To start a strong upward move, the price has to climb above the $55.00 resistance and the 55 simple moving average (4-hours). If not, there is a risk of another decline below the $47.50 level. The next major support is near the $45.00 level.
Looking at the chart, litecoin price is back in a bearish zone below the $51.20 and $50.00 support levels. In the short term, there could be an upside correction, but the price is likely to struggle to climb above $52.00 and $54.00. On the downside, the $45.00 support holds the key.
Technical indicators
4 hours MACD – The MACD for LTC/USD is showing negative signs in the bearish zone.
4 hours RSI (Relative Strength Index) – The RSI for LTC/USD is correcting from the oversold area.
Key Support Levels – $47.50 and $45.00.
Key Resistance Levels – $50.00 and $51.20.


Leave a Reply
You must be logged in to post a comment.