- Litecoin price is facing an increase in selling interest below $60.00 against the US Dollar.
- LTC price is currently trading below the key $59.80 and $57.00 support levels.
- There is a crucial bearish trend line forming with resistance near $57.10 on the 4-hours chart of the LTC/USD pair (data feed from Coinbase).
- The pair is likely to break the $54.00 support area and continue lower in the near term.
Litecoin price is back in a downtrend against the US Dollar and bitcoin. LTC price remains at a risk of more downsides as long as it is below $60.00.
Litecoin Price Analysis
In the past few days, there were steady downsides in bitcoin, Ethereum, ripple and litecoin against the US Dollar. LTC price broke the main $60.00 support area to enter a bearish zone.
Moreover, there was a break below the $57.00 support area and 55 simple moving average (4-hours). Finally, the price traded below the $55.00 level and formed a new monthly low at $54.06.
At the moment, the price is consolidating losses above the $54.00 level. An initial resistance is near the $55.40 level. Besides, the 23.6% Fib retracement level of the recent decline from the $59.88 high to $54.06 low is also near the $55.40 level.
More importantly, there is a key bearish pattern forming with resistance near $55.20 on the 4-hours chart of the LTC/USD pair. If there is an upside break above the $55.40 resistance, litecoin could test the next resistance near the $57.00 level.
The 50% Fib retracement level of the recent decline from the $59.88 high to $54.06 low is near the $57.00 area to stop the upward move. Additionally, there is a crucial bearish trend line forming with resistance near $57.10 on the 4-hours chart of the LTC/USD pair.
Above the trend line, the 55 simple moving average (4-hours) is near the $58.00 level. The main resistance is near the $60.00 level, above which the price is likely to start an uptrend.
Conversely, the price could continue to move down below the $55.00 and $54.00 support levels. A clear break below the $54.00 support could push the price towards the $50.00 support.
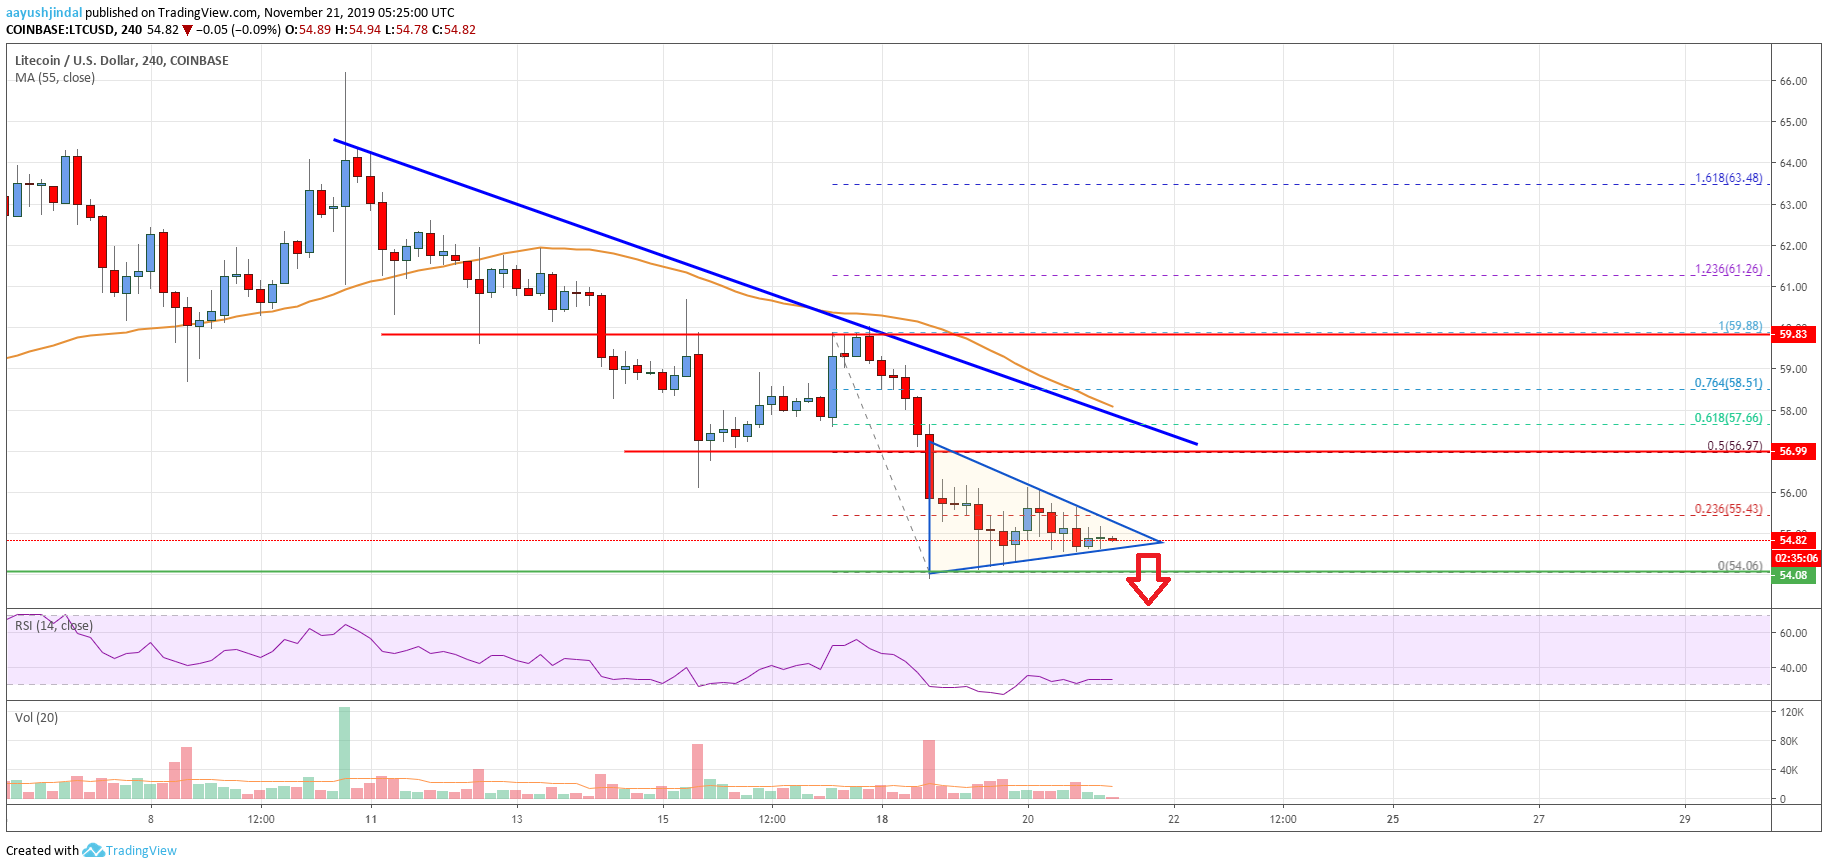
Looking at the chart, litecoin price is clearly forming another bearish breakdown pattern with support near $54.80and $54.00 levels. Therefore, there is a risk of more losses below $54.00 and $52.00 unless the price climbs above $58.00 and $60.00.
Technical indicators
4 hours MACD – The MACD for LTC/USD is currently moving in the bearish zone.
4 hours RSI (Relative Strength Index) – The RSI for LTC/USD is recovering, but it is well below the 40 level.
Key Support Levels – $54.00 and $50.00.
Key Resistance Levels – $58.00 and $60.00.


Leave a Reply
You must be logged in to post a comment.