
- Ripple price is currently declining and trading well below $0.2700 against the US dollar.
- The price is likely to continue lower and it may even test the $0.2420 support area.
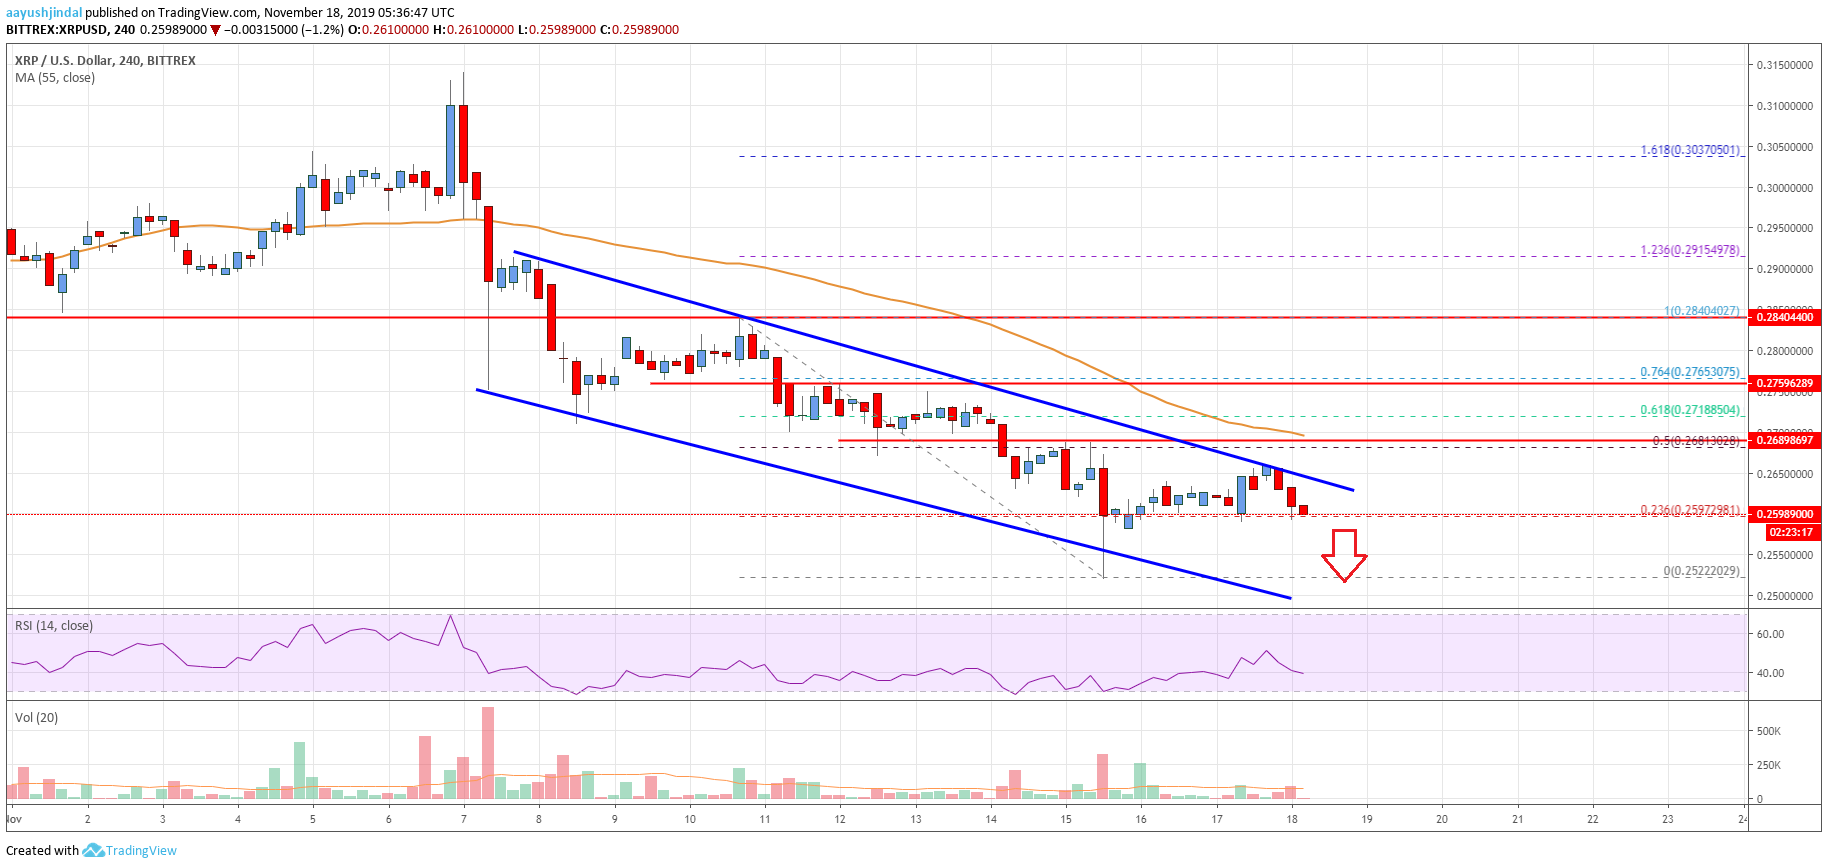
- There is a major declining channel forming with resistance near $0.2635 on the 4-hours chart of the XRP/USD pair (data source from Bittrex).
- The price could only start a decent recovery once it settles above the $0.2760 resistance area.
Ripple price is following a downtrend below the $0.2760 support against the US Dollar. XRP price might continue to move down towards $0.2500 and $0.2420.
Ripple Price Analysis
In the past few days, ripple price extended its decline below the $0.2840 support area against the US Dollar. XRP/USD gained bearish momentum below the $0.2760 support and the 55 simple moving average (4-hours).
As a result, there was a break below the $0.2685 support area. Finally, the price broke the $0.2550 support area and traded to a new monthly low at $0.2522.
Recently, there was an upside correction above the $0.2600 level. Additionally, the price moved above the 23.6% Fib retracement level of the downward move from the $0.2840 high to $0.2522 low.
However, ripple is currently facing resistance near the $0.2650 level. More importantly, there is a major declining channel forming with resistance near $0.2635 on the 4-hours chart of the XRP/USD pair.
Above the channel resistance, the next key hurdle is near the $0.2680 level and the 55 simple moving average (4-hours). Besides, the 50% Fib retracement level of the downward move from the $0.2840 high to $0.2522 low is near the $0.2680 level.
The main resistance is near the $0.2750 level, above which the price is likely to continue higher. The final barrier for a fresh uptrend is near the last breakdown level at $0.2840.
On the downside, there is a short-term support near the $0.2550 and $0.2520 levels. If the price fails to hold the $0.2520 support, there is a risk of more losses below the $0.2500 level. The next major stop for the bulls may perhaps be near the $0.2420 level.
Looking at the chart, ripple price is clearly following a bearish path below $0.2660 and $0.2750. Therefore, the bears are likely to aim more losses below the $0.2500 support. Conversely, the bulls need to gain strength above $0.2660 and $0.2750 to push the price back into a positive zone.
Technical indicators
4 hours MACD – The MACD for XRP/USD is currently gaining momentum in the bearish zone.
4 hours RSI (Relative Strength Index) – The RSI for XRP/USD is currently well below the 50 level, with bearish signs.
Key Support Levels – $0.2520, $0.2500 and $0.2420.
Key Resistance Levels – $0.2660 and $0.2750.


Leave a Reply
You must be logged in to post a comment.