
- Ripple price is currently trading in a bearish zone below $0.2840 against the US dollar.
- The price is at a risk of more downsides below the $0.2700 support area.
- There is a key bearish trend line forming with resistance near $0.2810 on the 4-hours chart of the XRP/USD pair (data source from Bittrex).
- The price could only recover once it clears the $0.2810 and $0.2840 resistance levels.
Ripple price is under pressure below the $0.2840 support against the US Dollar. XRP price might extend its decline if it breaks the $0.2700 support area.
Ripple Price Analysis
This past week, ripple price failed to break the $0.3135-$0.3140 resistance area against the US Dollar. As a result, XRP/USD started a downward move and broke many supports near $0.2980.
Moreover, there was a close below the $0.2980 level and the 55 simple moving average (4-hours). Finally, the price broke the key $0.2840 support area to enter a bearish zone. A low was formed near $0.2710 and the price is currently correcting losses.
It recovered above the $0.2760 and $0.2780 levels. Additionally, the price climbed above the 23.6% Fib retracement level of the last major decline from the $0.3138 high to $0.2710 low.
However, ripple is facing a strong resistance near the $0.2810 and $0.2840 levels. Besides, there is a key bearish trend line forming with resistance near $0.2810 on the 4-hours chart of the XRP/USD pair.
If there is an upside break above the trend line, the price could recover towards the $0.2900 resistance area. The 55 simple moving average (4-hours) is waiting near the $0.2900 area to act as a key hurdle for the bulls.
The next key resistance is near the $0.2925 level. It represents the 50% Fib retracement level of the last major decline from the $0.3138 high to $0.2710 low. Any further gains might push ripple towards the $0.2980 and $0.3000 resistance levels.
On the downside, there is a key support near the $0.2720 and $0.2700 levels. If the price fails to correct above $0.2840, there is a risk of another bearish break below the $0.2700 support area in the near term.
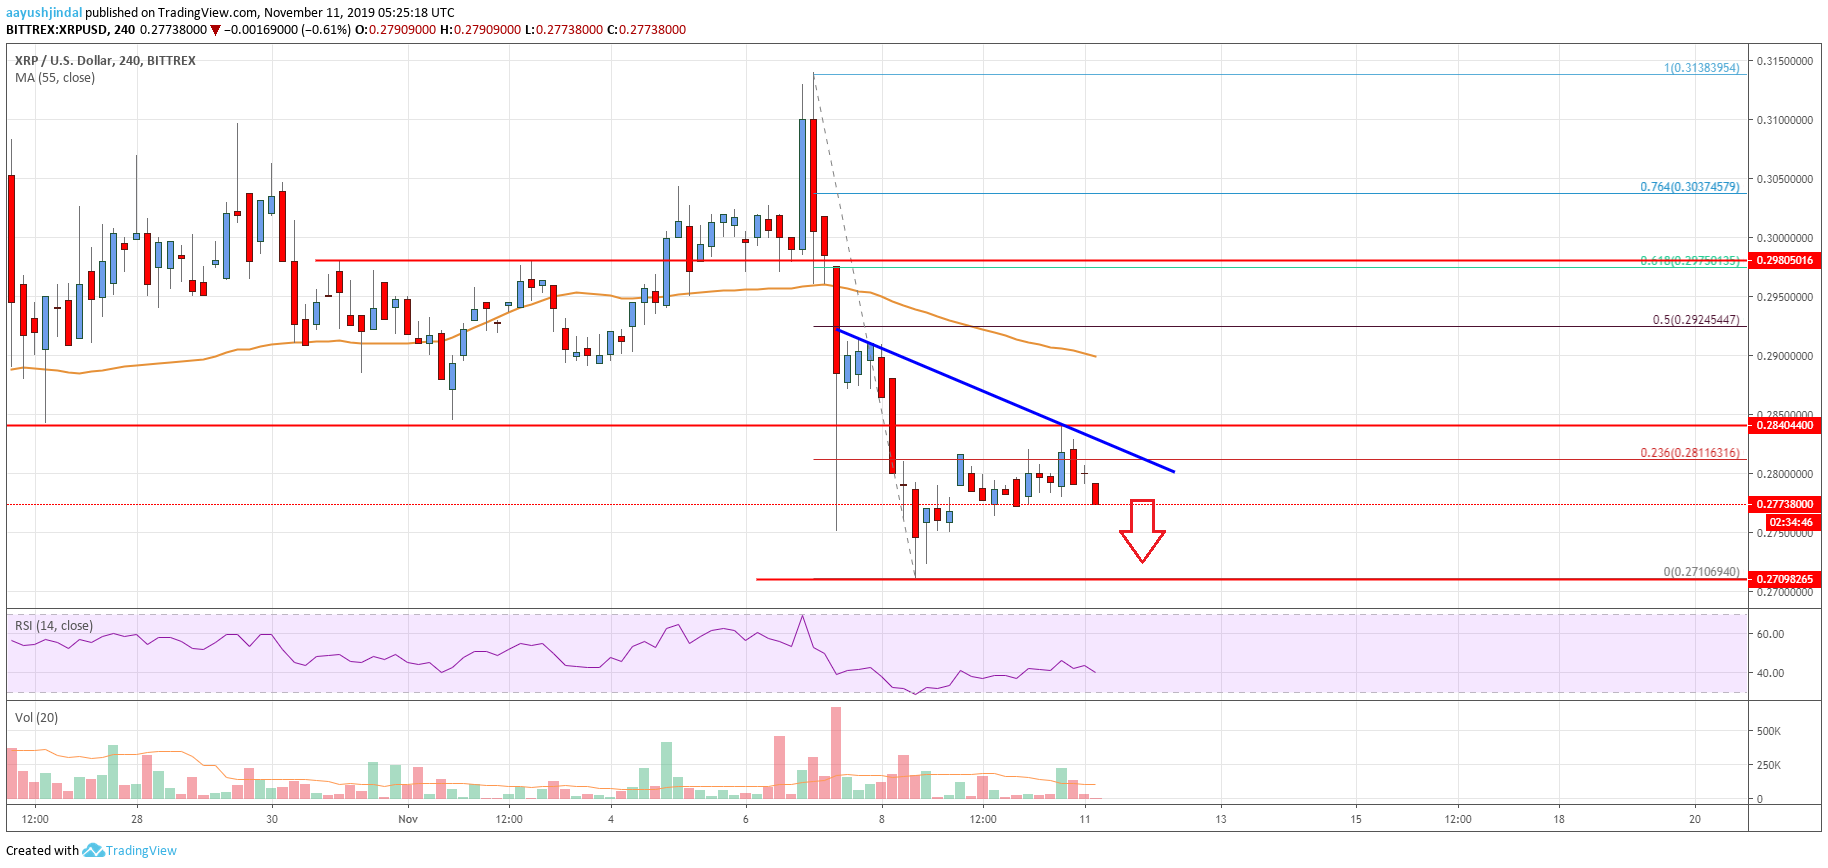
Looking at the chart, ripple price is clearly trading in a bearish zone below the $0.2810 and $0.2840 levels. Thus, the price remains at a risk of more losses below $0.2700 unless the bulls gain strength above the $0.2840 resistance level.
Technical indicators
4 hours MACD – The MACD for XRP/USD is currently gaining strength in the bearish zone.
4 hours RSI (Relative Strength Index) – The RSI for XRP/USD is currently declining and is below the 50 level.
Key Support Levels – $0.2760, $0.2720 and $0.2700.
Key Resistance Levels – $0.2810 and $0.2840.


Leave a Reply
You must be logged in to post a comment.