- Litecoin price is showing bearish signs and it declined from the $200 resistance against the US Dollar.
- LTC price is now trading well below the $200 level and the 55 simple moving average (4-hours).
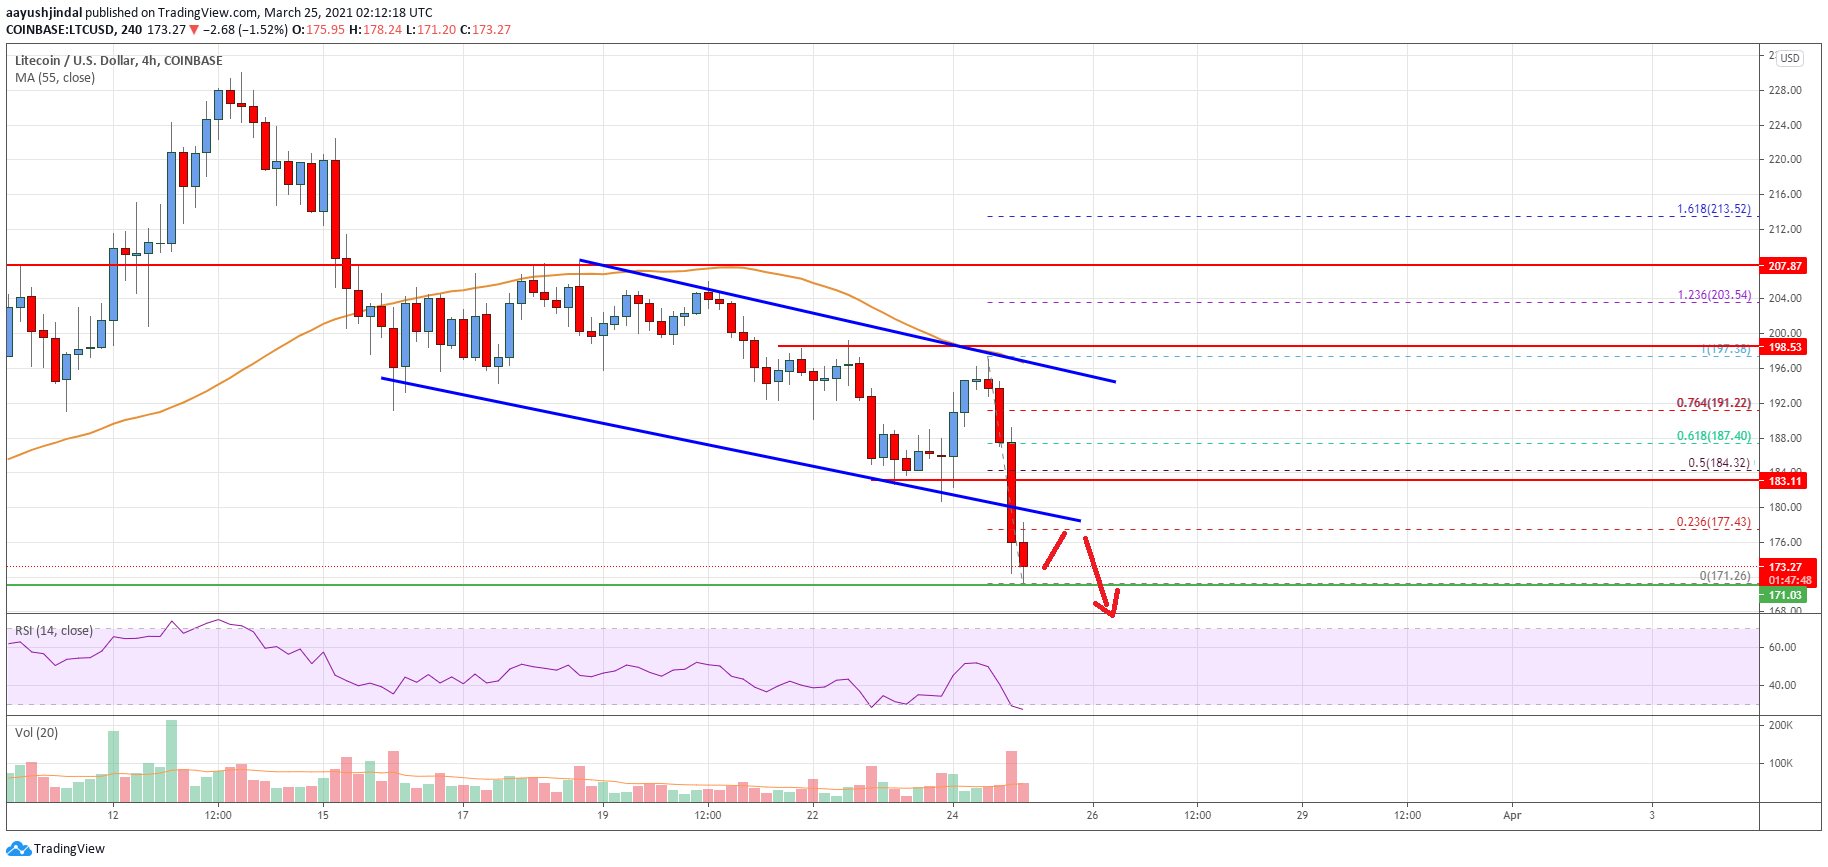
- There was a break below a declining channel with support near $180 on the 4-hours chart of the LTC/USD pair (data feed from Coinbase).
- The pair is likely to continue lower below $170 and $165 in the near term.
Litecoin price is showing bearish signs below $200 and $195 against the US Dollar, similar to bitcoin. LTC price could dive further unless it gains strength above $185.
Litecoin Price Analysis
This week, there was a downward move in bitcoin, Ethereum, ripple, and litecoin against the US Dollar. Earlier, LTC made a couple of attempts to gain strength above $200 and $202.
However, the bulls failed to gain strength, resulting in a fresh decline from the $200 barrier. The recent swing high was near $198 before there was a break below $190. There was also a break below a declining channel with support near $180 on the 4-hours chart of the LTC/USD pair.
The pair dipped below the $180 support zone and settled well below the 55 simple moving average (4-hours). A low is formed near $171 and the price is clearly showing bearish signs.
If there is a downside break below the $171 and $170 levels, there is a risk of more losses. The next major support is near the $165 level, below which the price could decline further towards the $150 level.
On the upside, an initial resistance is near the broken channel at $178. It is close to the 23.6% Fib retracement level of the downward move from the $198 high to $171 low. The next major resistance on the upside is near the $185 level.
The 50% Fib retracement level of the downward move from the $198 high to $171 low is also close to $185. The main resistance is now forming near $195, the 55 simple moving average (4-hours), and $200.

Looking at the chart, litecoin price is now trading well below $200 and it is testing the 55 simple moving average (4-hours). Overall, the price is likely to continue lower below $170 and $165 in the near term.
Technical indicators
4 hours MACD – The MACD for LTC/USD is currently gaining pace in the bearish zone.
4 hours RSI (Relative Strength Index) – The RSI for LTC/USD is now well below the 50 level.
Key Support Levels – $170 and $165.
Key Resistance Levels – $185 and $195.


Leave a Reply
You must be logged in to post a comment.