
- Litecoin price started a fresh decline below the $82.00 and $80.00 levels against the US Dollar.
- LTC price traded close to the $72.00 level and settled below the 55 simple moving average (4-hours).
- There is a major bearish trend line forming with resistance near $83.20 on the 4-hours chart of the LTC/USD pair (data feed from Coinbase).
- The pair is likely to face hurdles near $78.40 and $80.00 in the near term and resume its decline.
Litecoin price is currently trading in a bearish zone below $80.00 against the US Dollar, while bitcoin is above $18K. LTC price could continue to move down unless it breaks $80.00.
Litecoin Price Analysis
This week, there was a steady decline in bitcoin, Ethereum, ripple, and litecoin against the US Dollar. Earlier, LTC price failed to clear the $90.00 resistance level and started a fresh decline.
The last swing high was formed near $86.95 before there was a sharp decline. The price broke the $80.00 support level and settled below the 55 simple moving average (4-hours). There was also a break below the $75.00 level and the price traded close to $72.00.
A low is formed near $72.16 and the price is currently correcting higher. It surpassed the $75.00 level. There was also a break above the 23.6% Fib retracement level of the recent decline from the $86.95 high to $72.16 low.
It is now facing hurdles near the $78.40 level (a previous support and now resistance). The next key resistance is near the $80.00 level. It is also close to the 50% Fib retracement level of the recent decline from the $86.95 high to $72.16 low.
Moreover, there is a major bearish trend line forming with resistance near $83.20 on the 4-hours chart of the LTC/USD pair. Litecoin price must clear the $78.40 and $80.00 resistance levels to increase the chances of a fresh increase above $84.00.
Conversely, the price could continue to move down below $74.00. The first key support is near the $72.00 level. The next major support is near the $70.00 level, below which it could decline towards the $64.00 level.
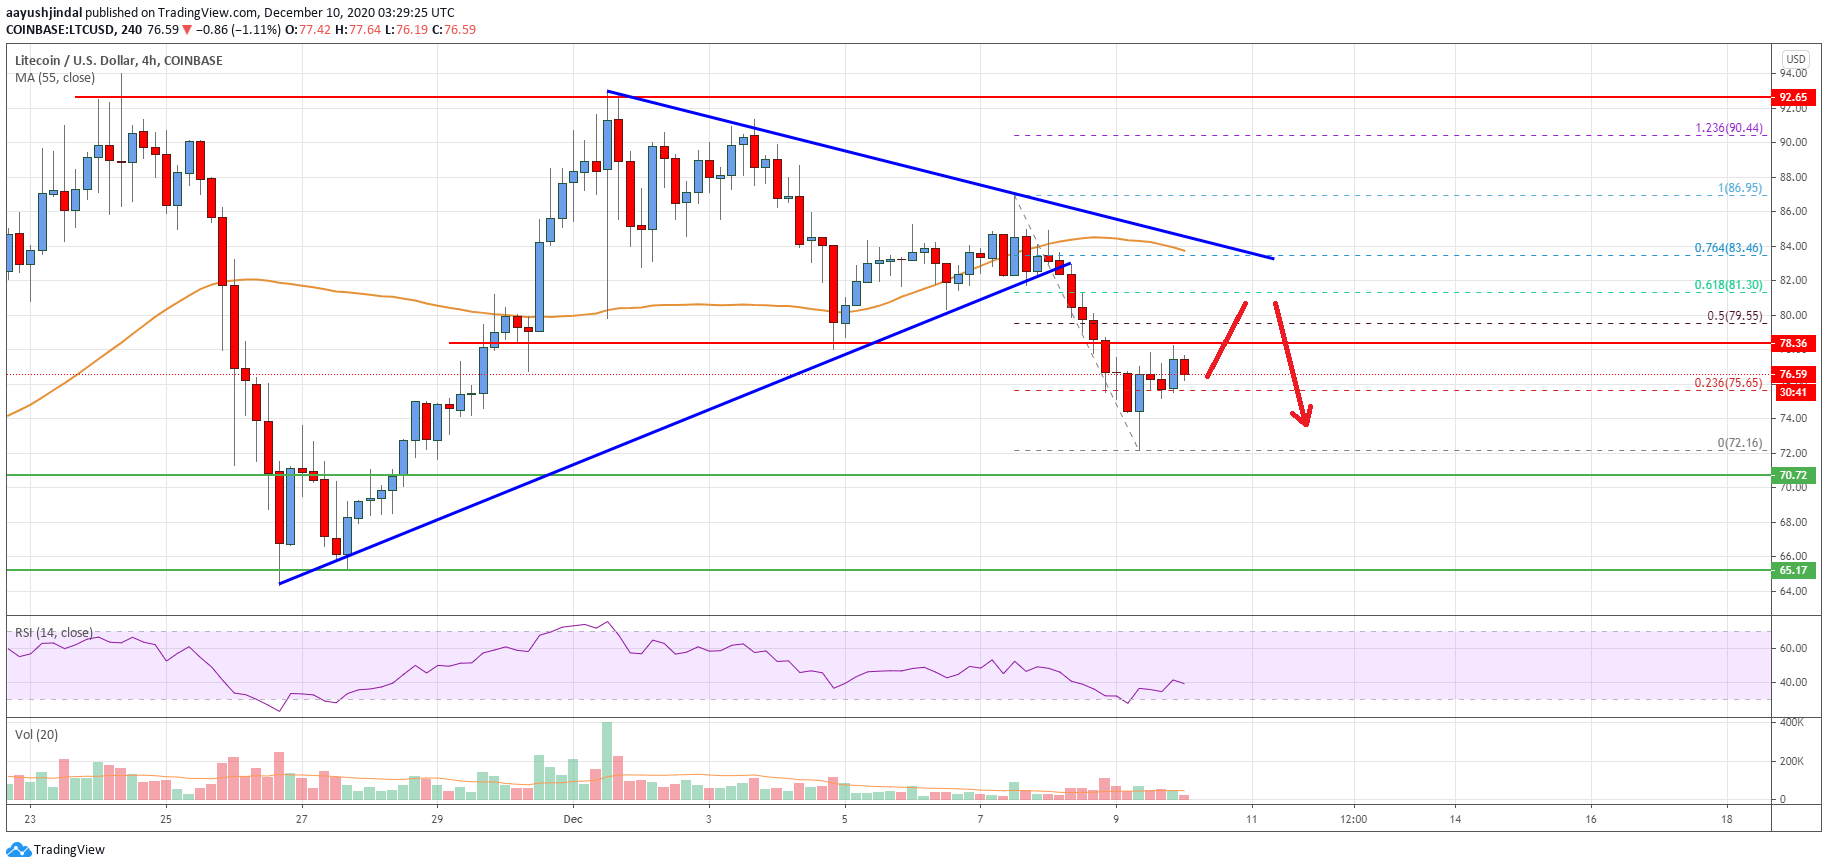
Looking at the chart, litecoin price is clearly showing bearish signs below $80.00 and the 55 simple moving average (4-hours). Overall, the price is likely to face hurdles near $78.40 and $80.00 in the near term and resume its decline.
Technical indicators
4 hours MACD – The MACD for LTC/USD is currently struggling to gain momentum in the bullish zone.
4 hours RSI (Relative Strength Index) – The RSI for LTC/USD is well below the 50 level.
Key Support Levels – $72.00 and $70.00.
Key Resistance Levels – $78.40 and $80.00.


Leave a Reply
You must be logged in to post a comment.