
 Emily John·12hr ago
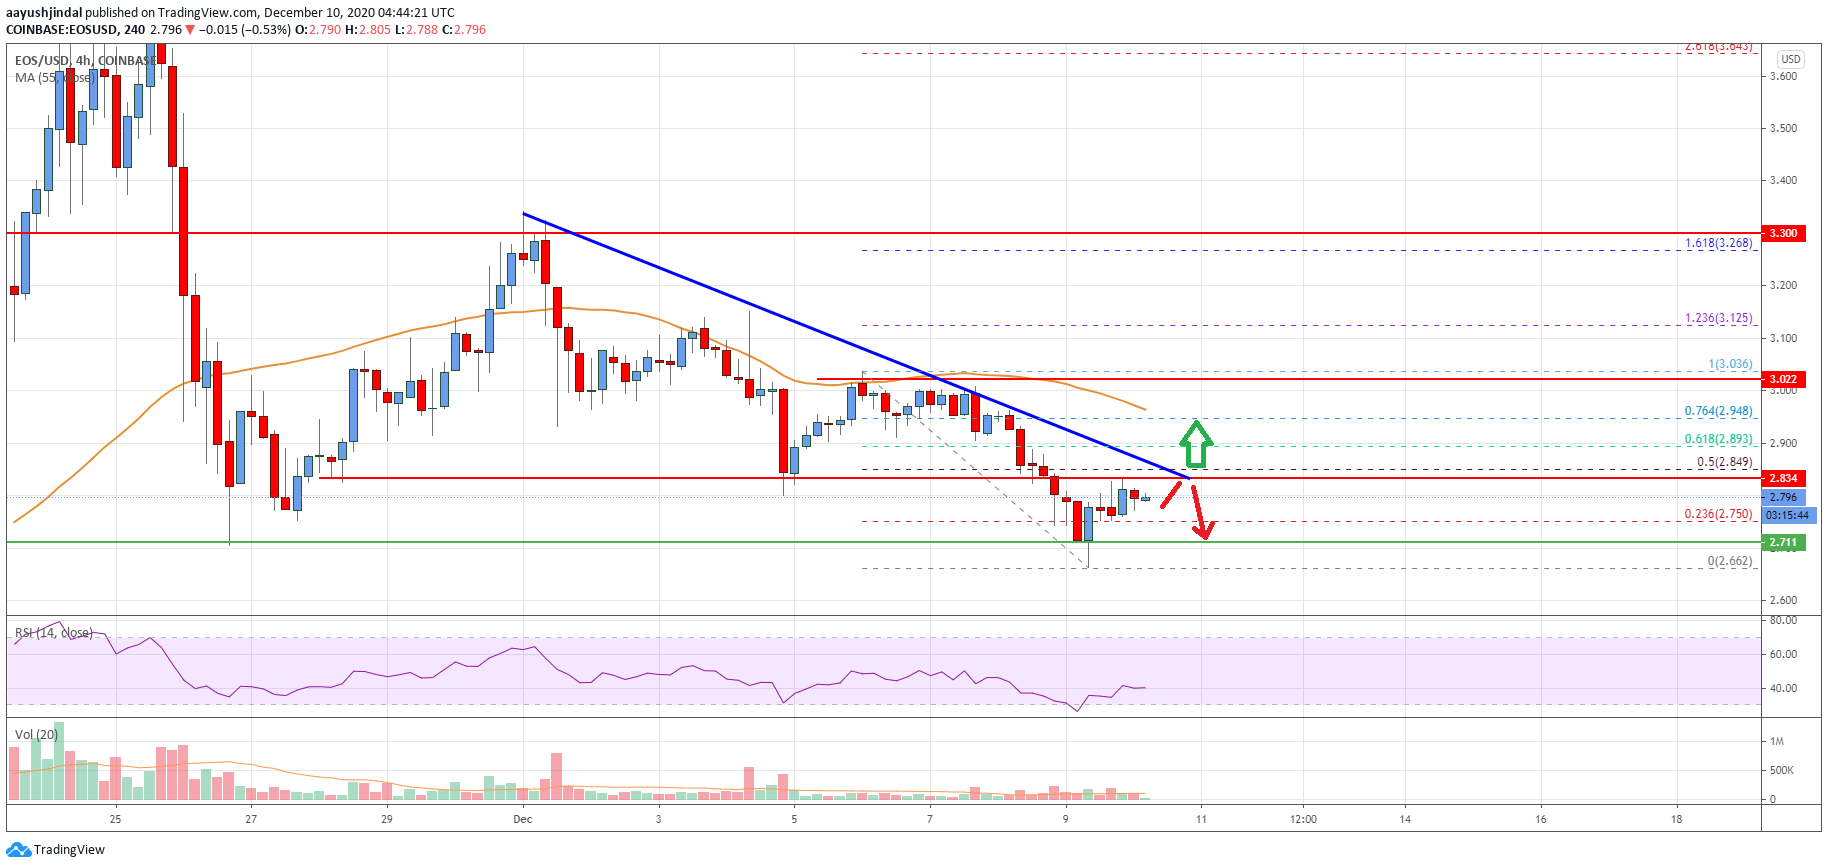
EOS price is facing a lot of hurdles on the upside near $2.900 against the US Dollar, similar to bitcoin. The price could retest $2.500 as long as it is below $2.900 and $3.000.
In the past few days, EOS price followed a bearish path below the $3.000 resistance zone against the US Dollar. The price even settled below the $2.900 pivot level and the 55 simple moving average (4-hours).
The decline gained pace below the $2.750 level and the price traded as low as $2.662. Recently, there was an upside correction above the $2.700 level. The price corrected above the 23.6% Fib retracement level of the recent decline from the $3.036 high to $2.662 low.
However, the price is facing a strong resistance near the $2.850 and $2.900 levels. There is also a key bearish trend line forming with resistance near $2.840 on the 4-hours chart of the EOS/USD pair.
The trend line is close to the 50% Fib retracement level of the recent decline from the $3.036 high to $2.662 low. The next major resistance is near the $2.900, above which the price is likely to face a strong selling interest near the $2.950 level and the 55 simple moving average (4-hours).
To move into a positive zone, the price must surpass $2.900, and then settle above the 55 simple moving average (4-hours). If not, there is a risk of more losses below the $2.700 support level.
An initial support is near the $2.650 level. A clear break below the recent low and $2.650 might lead the price towards the $2.500 support level.
Looking at the chart, EOS price is clearly trading in a bearish zone below the $2.900 level and the 55 simple moving average (4-hours). Overall, the price could continue to move down as long as it is below the $2.850 and $2.900 resistance levels.
4-hours MACD – The MACD for EOS/USD is struggling to gain momentum in the bullish zone.
4-hours RSI (Relative Strength Index) – The RSI is now just below the 40 level.
Major Support Levels – $2.700 and $2.650.
Major Resistance Levels – $2.900 and $3.000.
Related News
Explore more