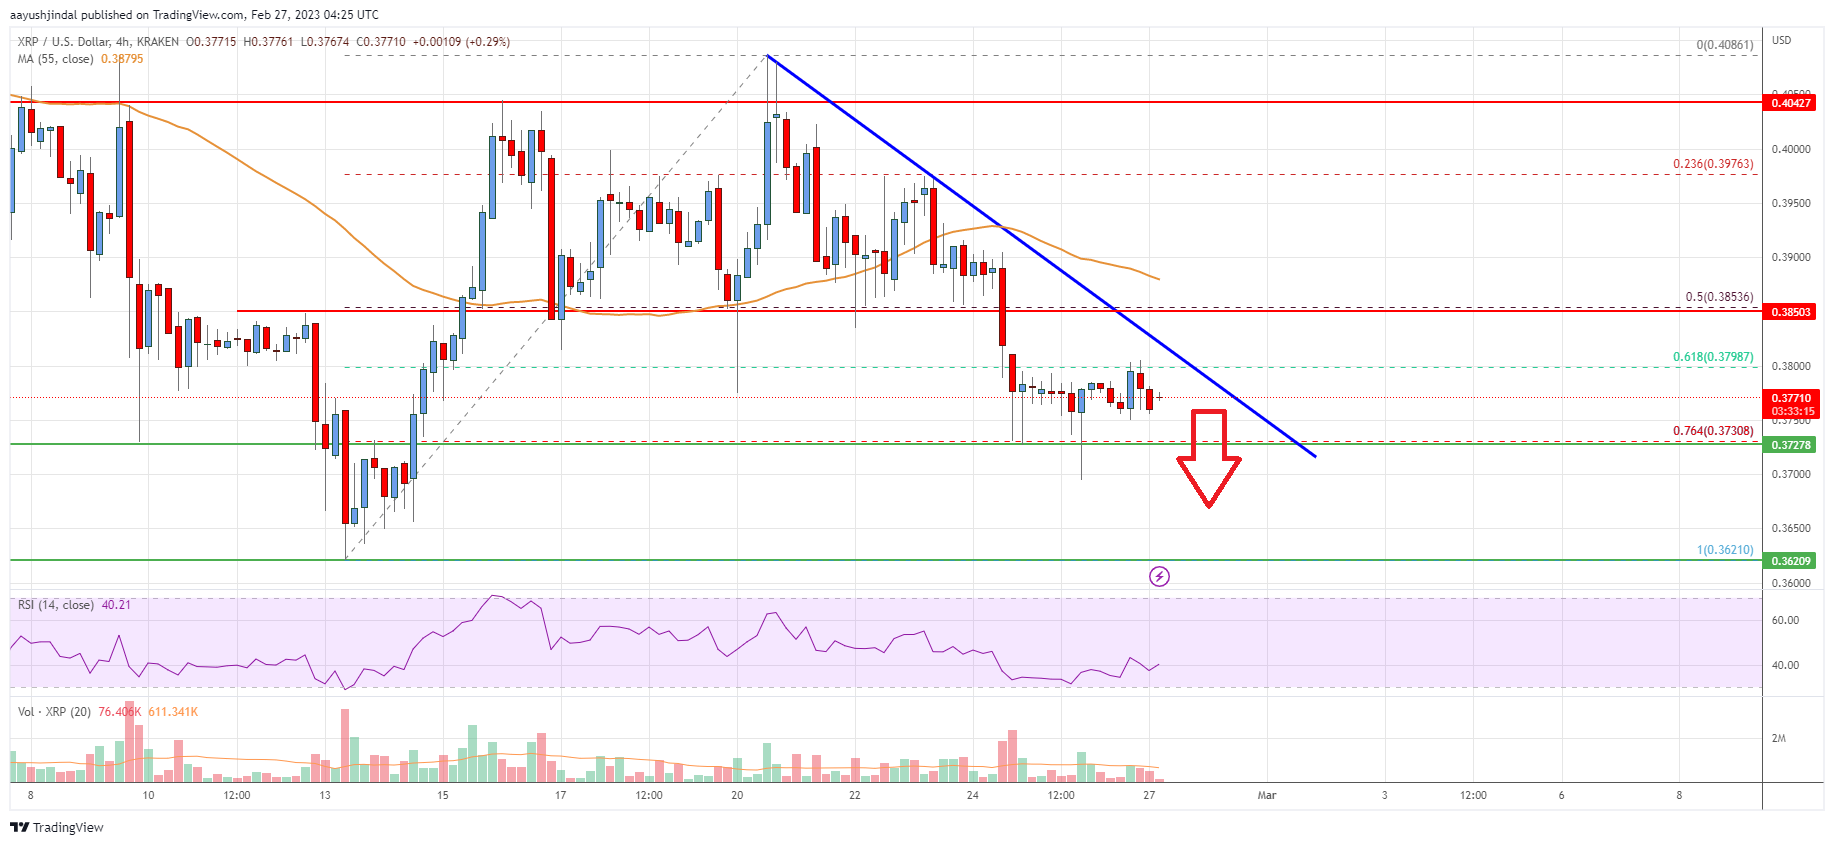
- Ripple price started a fresh decline from the $0.400 zone against the US dollar.
- The price is now trading below $0.3850 and the 55 simple moving average (4-hours).
- There is a key bearish trend line forming with resistance near $0.3800 on the 4-hours chart of the XRP/USD pair (data source from Bittrex).
- The pair could extend losses if it stays below the $0.3850 resistance zone.
Ripple price is struggling below $0.3850 against the US Dollar, similar to bitcoin. XRP price must stay above $0.3620 to avoid more downsides in the near term.
Ripple Price Analysis
This past week, ripple price saw a bearish reaction from the $0.4050 zone against the US Dollar. The XRP/USD pair declined below the $0.3920 support zone to move into a bearish zone.
The recent move was such that the price declined below $0.3850 and the 55 simple moving average (4-hours). There was a clear move below the 50% Fib retracement level of the upward move from the $0.3620 swing low to $0.4086 high.
It is now trading below $0.3850 and the 55 simple moving average (4-hours). There is also a key bearish trend line forming with resistance near $0.3800 on the 4-hours chart of the XRP/USD pair.
An initial support on the downside is near the $0.3730. It is near the 76.4% Fib retracement level of the upward move from the $0.3620 swing low to $0.4086 high. The next major support is near the $0.3650 level or the last swing low.
Any more losses could lead the price towards the $0.3500 level, below which the price might even test $0.3320. On the upside, the price is facing resistance near $0.3800 and the trend line.
The next major resistance is near the $0.3850 level. The main resistance is near the $0.3900 zone. A clear move above the $0.3850 and $0.3900 resistance zones might start a fresh increase. In the stated case, the price could even surpass the $0.4000 resistance. Any more gains might send the price towards the $0.415 resistance.

Looking at the chart, ripple price is now trading below the $0.385 zone and the 55 simple moving average (4-hours). Overall, the price could extend losses if it stays below the $0.3850 resistance zone.
Technical indicators
4 hours MACD – The MACD for XRP/USD is now gaining momentum in the bearish zone.
4 hours RSI (Relative Strength Index) – The RSI for XRP/USD is below the 50 level.
Key Support Levels – $0.3730, $0.3620 and $0.3500.
Key Resistance Levels – $0.3850 and $0.3900.


Leave a Reply
You must be logged in to post a comment.