- Stellar lumen price is showing bearish signs below the $0.092 resistance zone against the US Dollar.
- XLM price is now trading below $0.090 and the 55 simple moving average (4-hours).
- There was a break below a key bullish trend line with support near $0.0920 on the 4-hours chart (data feed via Kraken).
- The pair could start another decline if there is a clear move below the $0.0865 support.
Stellar lumen price is trading below $0.090 against the US Dollar, similar to bitcoin. XLM price must stay above the $0.0865 support to avoid more losses.
Stellar Lumen Price Analysis (XLM to USD)
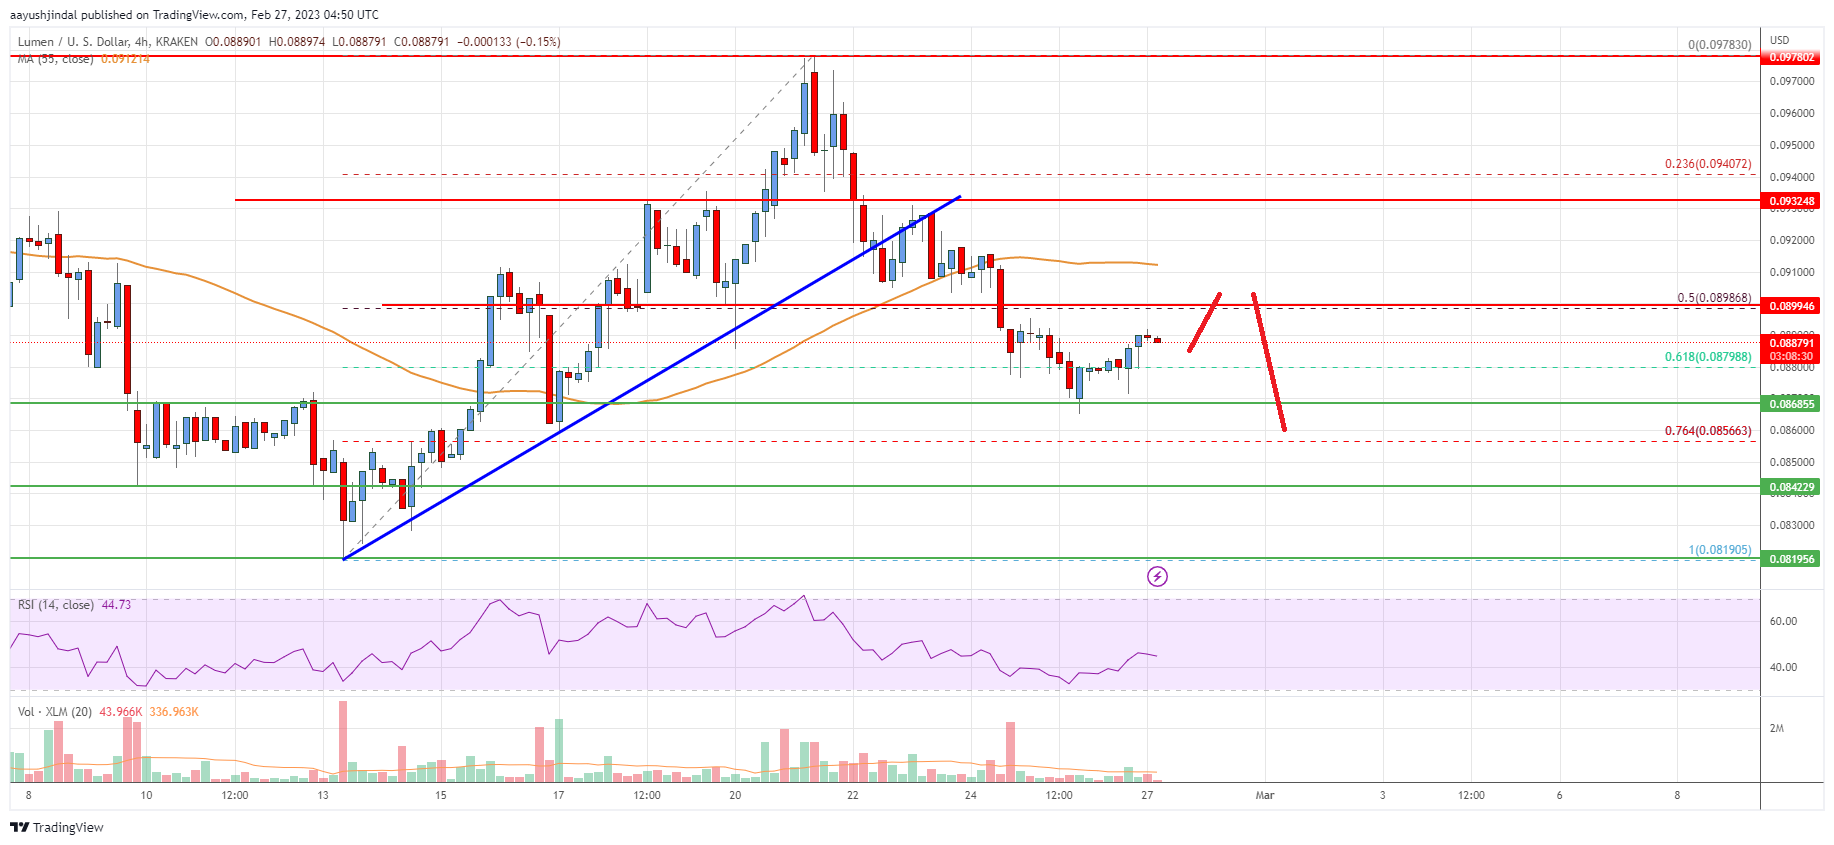
After a failed attempt near the $0.098 zone, stellar lumen price started a fresh decline against the US Dollar. The XLM/USD pair traded below the $0.0920 support to move into a bearish zone.
Besides, there was a break below a key bullish trend line with support near $0.0920 on the 4-hours chart. The pair slowly moved below the 50% Fib retracement level of the upward move from the $0.0819 swing low to $0.0978 high.
XLM price is now trading below $0.090 and the 55 simple moving average (4-hours). It is struggling to stay above the 61.8% Fib retracement level of the upward move from the $0.0819 swing low to $0.0978 high.
On the upside, the price is facing resistance near the $0.090 level. The next major resistance is near the $0.0915 zone and the 55 simple moving average (4-hours). The main resistance sits near the $0.094 level. A clear upside break above the $0.0940 zone might send the price towards $0.0980.
Any more gains could lead the price towards the $0.1050 level or even $0.1120. An initial support on the downside is near the $0.0865 level.
The main support is near the $0.084 zone. Any more losses could lead the price towards the $0.082 level in the near term, below which the price might even retest $0.0780.

The chart indicates that XLM price is now trading below $0.090 and the 55 simple moving average (4-hours). Overall, the price could start a major decline if there is a clear move below the $0.0865 support.
Technical Indicators
4 hours MACD – The MACD for XLM/USD is losing momentum in the bearish zone.
4 hours RSI – The RSI for XLM/USD is now below the 50 level.
Key Support Levels – $0.0865 and $0.0820.
Key Resistance Levels – $0.0900, $0.0920 and $0.094.


Leave a Reply
You must be logged in to post a comment.