- Ripple price is slowly moving higher towards the $0.4800 and $0.5000 resistance levels against the US dollar.
- The price is now stable above the $0.4450 zone and the 55 simple moving average (4-hours).
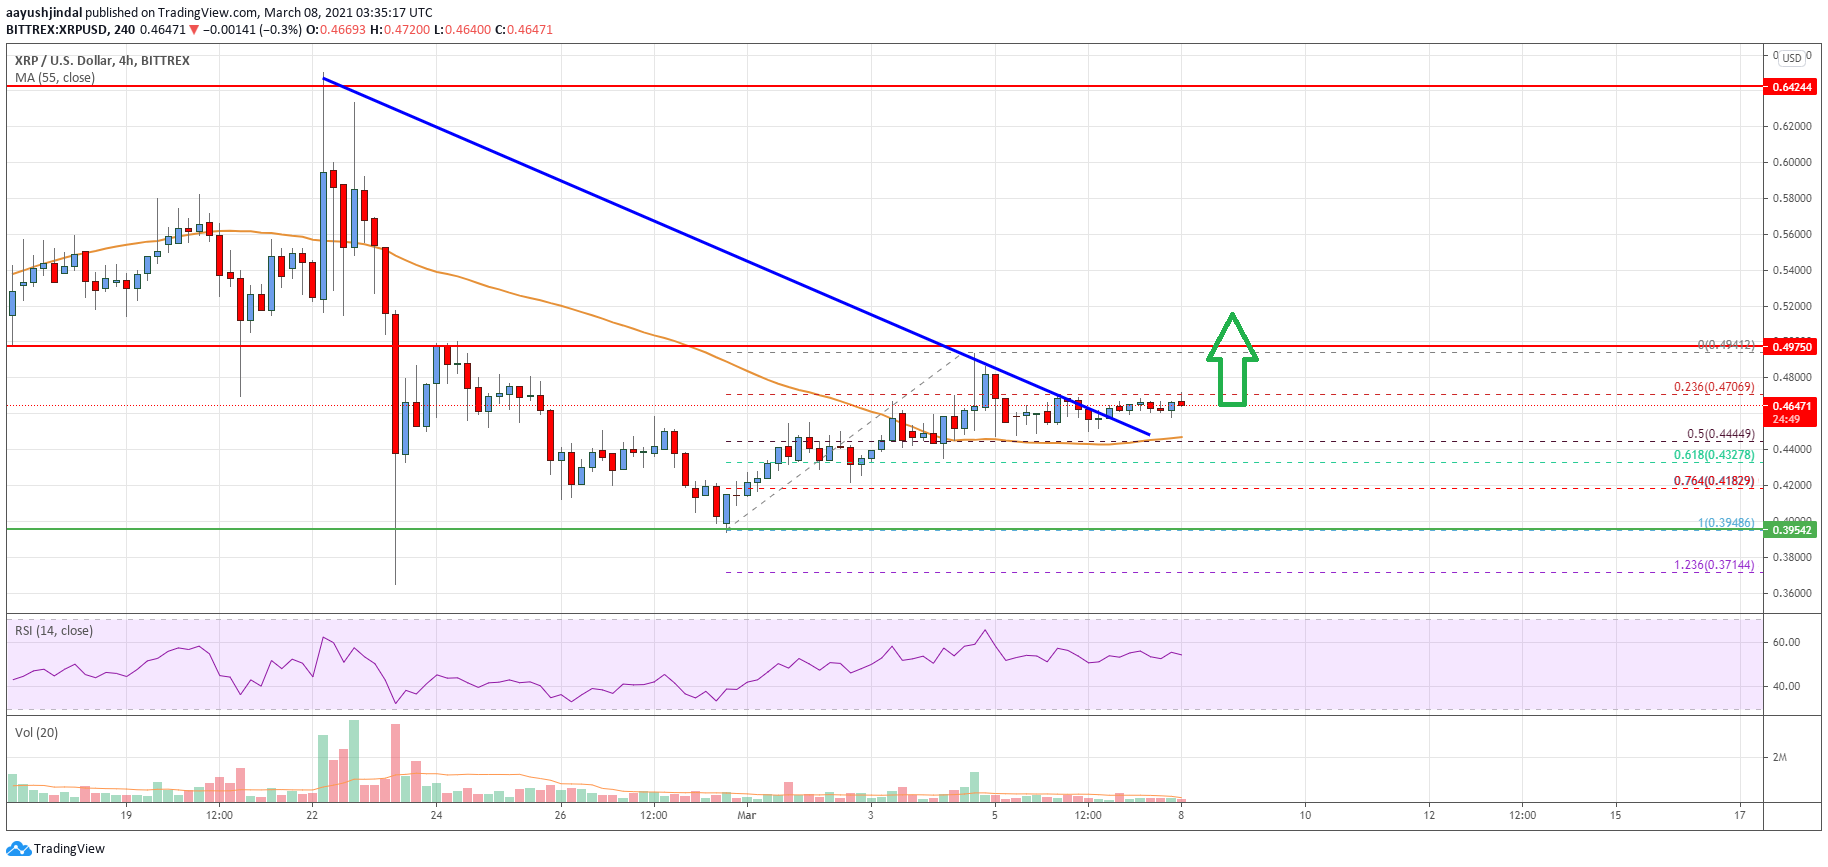
- There was a break above a major bearish trend line with resistance near $0.4500 on the 4-hours chart of the XRP/USD pair (data source from Bittrex).
- The pair is likely to continue higher once it clears the $0.4800 and $0.5000 resistance levels.
Ripple price is showing a few positive signs above $0.4500 against the US Dollar. XRP price could start a strong increase if there is a daily close above $0.5000.
Ripple Price Analysis
After struggling to clear the $0.5000 resistance, ripple price corrected lower against the US Dollar. The XRP/USD pair traded below the $0.4900 and $0.4820 support levels.
There was also a break below the $0.4800 support zone. The price dipped below the 23.6% Fib retracement level of the upward move from the $0.3948 low to $0.4941 high. However, the bulls are protecting sharp losses below the $0.4500 level.
The price is now stable above the $0.4450 zone and the 55 simple moving average (4-hours). There was also a break above a major bearish trend line with resistance near $0.4500 on the 4-hours chart of the XRP/USD pair.
It is trading nicely above the 50% Fib retracement level of the upward move from the $0.3948 low to $0.4941 high. If there is a downside break below the $0.4450 support and the 55 simple moving average (4-hours), there is a risk of a sharp decline in the coming sessions.
The next major support is near the $0.4200 level. On the upside, an initial resistance is near the $0.4800 level. The main resistance is still near the $0.5000 level. If there is a daily close above $0.5000, the price could rise steadily towards the $0.5200 and $0.5400 levels.
Looking at the chart, ripple price is clearly trading well above the $0.4450 zone and the 55 simple moving average (4-hours). Overall, the price is likely to continue higher once it clears the $0.4800 and $0.5000 resistance levels.
Technical indicators
4 hours MACD – The MACD for XRP/USD is struggling to gain momentum in the bullish zone.
4 hours RSI (Relative Strength Index) – The RSI for XRP/USD is just above the 50 level.
Key Support Levels – $0.4500, $0.4450 and $0.4200.
Key Resistance Levels – $0.4800 and $0.5000.
