
- Ripple price started a recovery wave from the $0.8000 zone against the US dollar.
- The price is now trading below $0.88 and the 55 simple moving average (4-hours).
- There is a connecting resistance trend line near $0.8650 on the 4-hours chart of the XRP/USD pair (data source from Bittrex).
- The pair could continue to move up if there is a clear break above the $0.8650 resistance.
Ripple price is struggling below $0.900 against the US Dollar, like bitcoin. XRP price could extend recovery if there is a move above the $0.900 hurdle.
Ripple Price Analysis
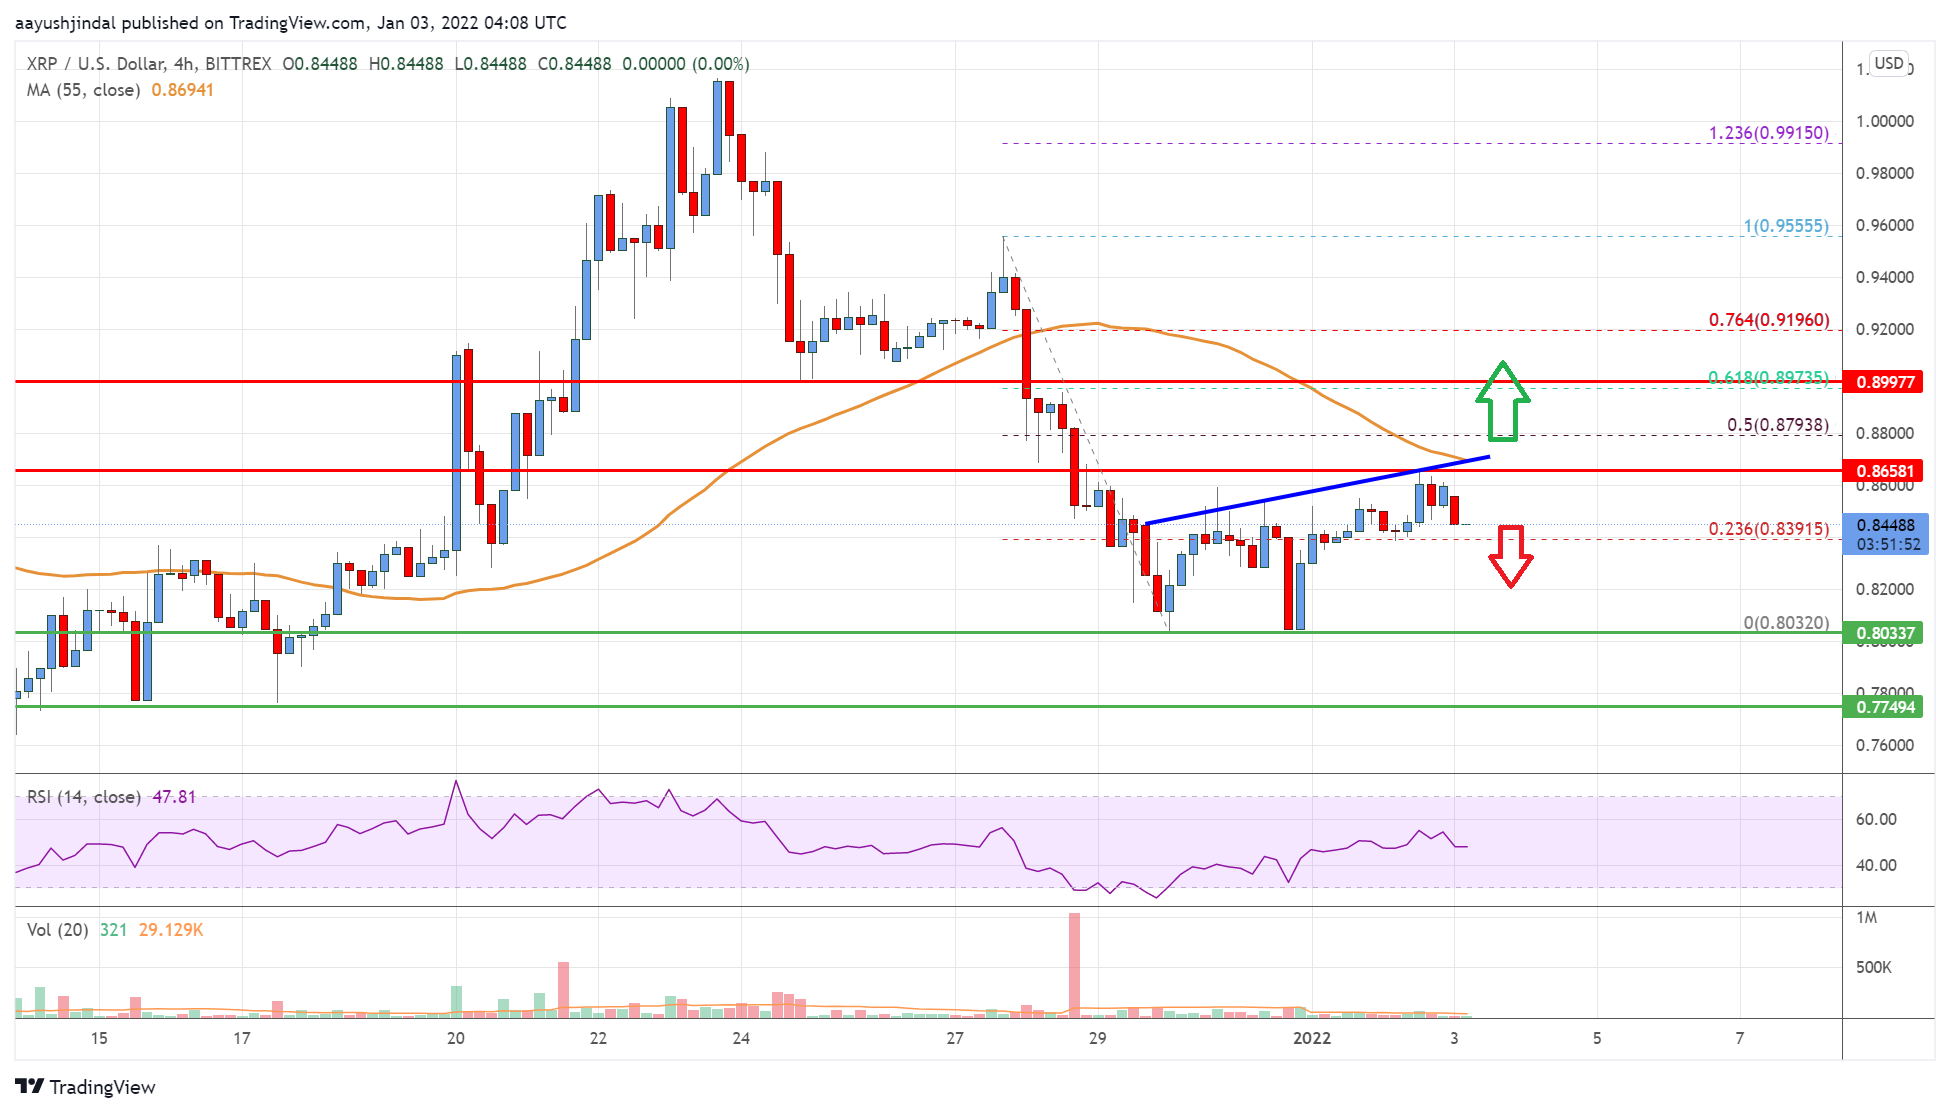
After struggling to clear the $0.9500 zone, ripple price started a fresh decline against the US Dollar. The XRP/USD pair declined below the $0.9000 support zone to move into a bearish zone.
The pair declined sharply below the $0.8500 level and the 55 simple moving average (4-hours). The pair traded as low as $0.8032 and currently recovering losses. There was a recovery wave above the $0.8200 level. The bulls pushed the price above the 23.6% Fib retracement level of the downward move from the $0.9555 swing high to $0.8032 low.
On the upside, the price is facing resistance near the $0.8650 level. There is also a connecting resistance trend line near $0.8650 on the 4-hours chart of the XRP/USD pair.
The next key resistance is near the $0.8800 level. It is near the 50% Fib retracement level of the downward move from the $0.9555 swing high to $0.8032 low. A close above the $0.8800 level could push the price towards the $0.900- level.
The next major resistance is near the $1.00 level. Any more gains could lead the price towards the $1.12 level. If there is no upside break above $0.8650, the price could resume decline. The next major support is near the $0.8320 level. Any more losses could lead the price towards the $0.8000 level in the near term.
Looking at the chart, ripple price is now trading below $0.90 and the 55 simple moving average (4-hours). Overall, the price could continue to move up if there is a clear break above the $0.8650 resistance.
Technical indicators
4 hours MACD – The MACD for XRP/USD is now losing momentum in the bullish zone.
4 hours RSI (Relative Strength Index) – The RSI for XRP/USD is near the 50 level.
Key Support Levels – $0.8320, $0.820 and $0.800.
Key Resistance Levels – $0.865 and $0.880.


Leave a Reply
You must be logged in to post a comment.