- Ripple price started a major decline from the $1.12 resistance against the US dollar.
- The price is now trading below $1.00 and the 55 simple moving average (4-hours).
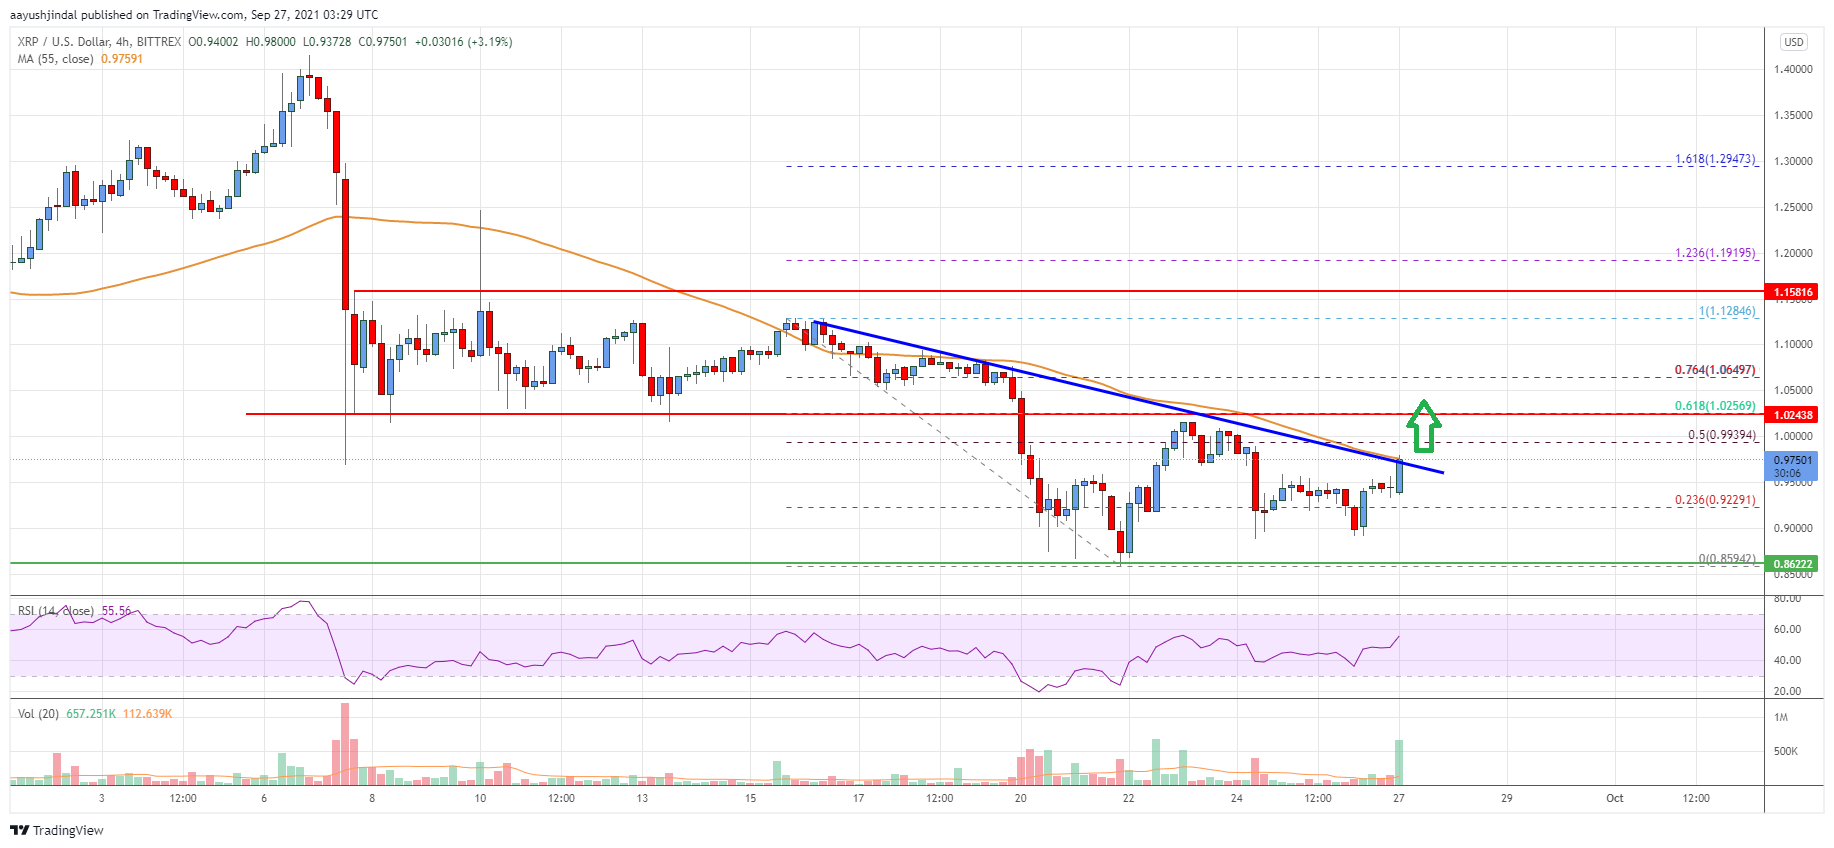
- There is a key bearish trend line forming with resistance near $0.9750 on the 4-hours chart of the XRP/USD pair (data source from Bittrex).
- The pair could start a steady increase if there is a clear break above $1.00.
Ripple price is showing bearish signs below $1.00 against the US Dollar, similar to bitcoin. XRP price must clear $1.00 for a steady increase in the near term.
Ripple Price Analysis
After consolidating below $1.20, ripple price started a fresh decline against the US Dollar. The XRP/USD pair topped near $1.125 and started a major decline.
There was a break below the $1.05 and $1.00 support levels. The pair also settled below the $1.00 level and the 55 simple moving average (4-hours). It traded as low as $0.8594 and recently started an upside correction.
There was a break above the $0.9000 and $0.9200 resistance levels. The price climbed above the 23.6% Fib retracement level of the recent decline from the $0.1284 swing high to $0.8594. It is now trading above $0.9500, but it is facing hurdles.
There is a key bearish trend line forming with resistance near $0.9750 on the 4-hours chart of the XRP/USD pair. The next key resistance is near the $0.9950 and $1.00 levels.
The 50% Fib retracement level of the recent decline from the $0.1284 swing high is also near the $1.00 zone. A close above the $1.00 could set the pace for more gains. The next major resistance is near the $1.10 level. Any more gains could lead the price towards the $1.20 level.
On the downside, an initial support is near the $0.9500 level. The first major support is near the $0.9200 level. Any more losses could lead the price towards the $0.8500 level in the near term.

Looking at the chart, ripple price is still trading below $1.00 and the 55 simple moving average (4-hours). Overall, the price could start a steady increase if there is a clear break above $1.00.
Technical indicators
4 hours MACD – The MACD for XRP/USD is now gaining momentum in the bullish zone.
4 hours RSI (Relative Strength Index) – The RSI for XRP/USD is now above the 50 level.
Key Support Levels – $0.9500, $0.9200 and $0.8500.
Key Resistance Levels – $1.00 and $1.05.


Leave a Reply
You must be logged in to post a comment.