- Ripple price is currently correcting higher after a massive decline of 50% against the US dollar.
- The price is back above the $0.1400 area, but it is facing a lot of hurdles.
- There is a major bearish trend line forming with resistance near $0.1700 on the 4-hours chart of the XRP/USD pair (data source from Bittrex).
- The pair is likely to struggle near the $0.1650 and $0.1700 resistance levels in the near term.
Ripple price is slowly recovering from the $0.1100 yearly low against the US Dollar. XRP price is now facing a couple of strong resistances near the $0.1700 area.
Ripple Price Analysis
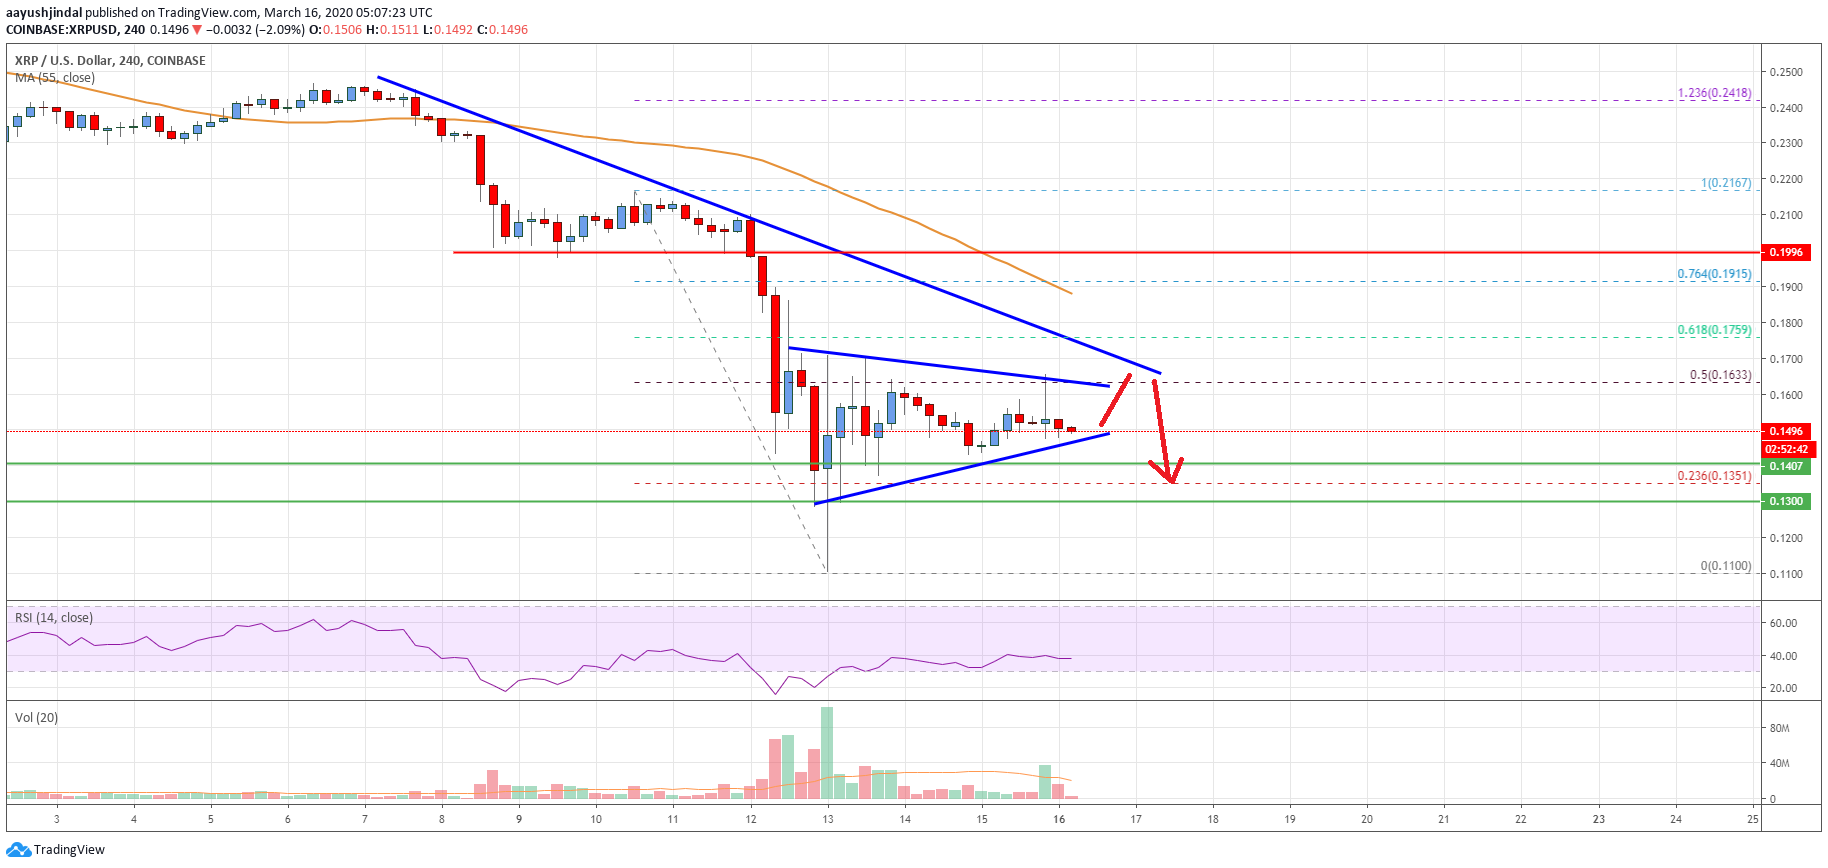
This past week, there was a sharp decline in ripple price from well above $0.1900 against the US Dollar. XRP/USD broke many key supports near the $0.1800 and $0.1650 support levels to enter a bearish zone.
Moreover, there was a close below the $0.1800 level and the 55 simple moving average (4-hours). The price traded as low as $0.1100 and recently started an upside correction. There was a break above the $0.1300 resistance area.
The price also recovered above the 23.6% Fib retracement level of the key drop from the $0.2167 high to $0.1100 low. It is now trading nicely above the $0.1420 level, but also facing a strong resistance near $0.1635.
The 50% Fib retracement level of the key drop from the $0.2167 high to $0.1100 low seems to be acting as a major barrier for the bulls. There is also a major bearish trend line forming with resistance near $0.1700 on the 4-hours chart of the XRP/USD pair.
If there is an upside break above the $0.1635 resistance level and the trend line, there are chances of a decent recovery in the near term.
The next major resistance is near the $0.1900 area and the 55 simple moving average (4-hours). Conversely, the price might fail to continue above the $0.1635 and $0.1700 resistance levels.
On the downside, a major support is visible near the $0.1405 area. A successful downside break below the $0.1400 area could start a fresh decline towards the $0.1200 support in the near term.
Looking at the chart, ripple price is clearly struggling to clear a couple of important barriers near $0.1635. Therefore, there is a risk of more losses below $0.1400 unless there is a clear break above $0.1700.
Technical indicators
4 hours MACD – The MACD for XRP/USD is losing momentum in the bullish zone.
4 hours RSI (Relative Strength Index) – The RSI for XRP/USD is below the 40 level and it is sliding.
Key Support Levels – $0.1405, $0.1350 and $0.1300.
Key Resistance Levels – $0.1635 and $0.1700.