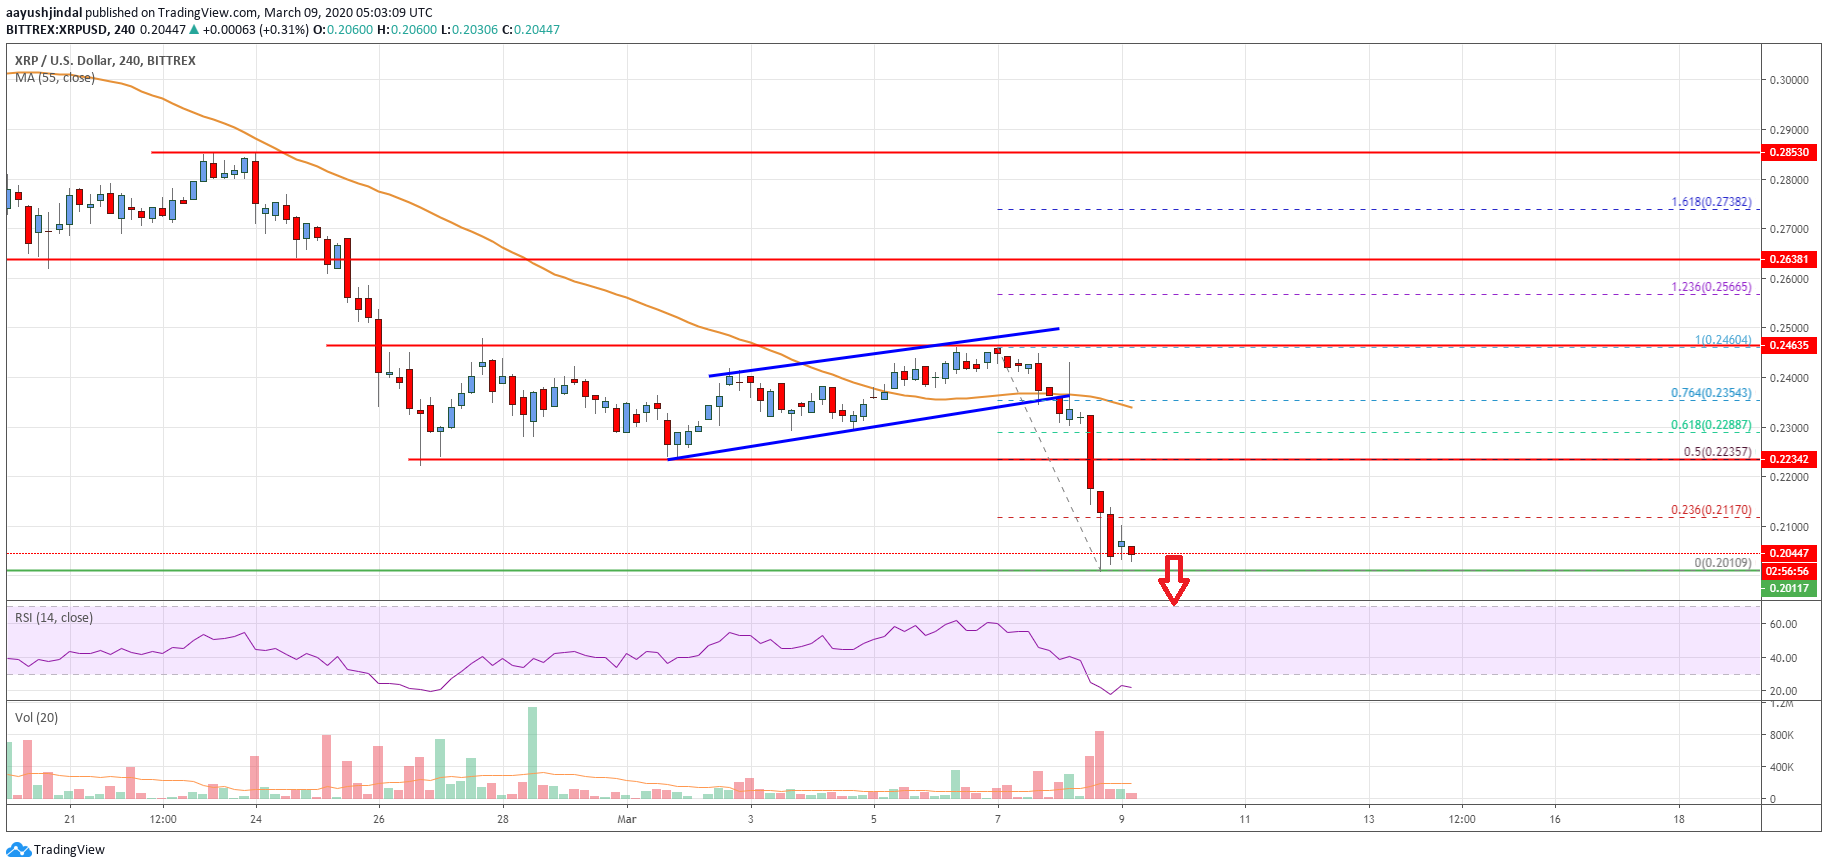
- Ripple price declined heavily below the key $0.2240 support area against the US dollar.
- The price is down more than 10% and it is now trading near the $0.2000 support area.
- There was a break below a major ascending channel with support near $0.2350 on the 4-hours chart of the XRP/USD pair (data source from Bittrex).
- The pair remains at a risk of more losses if it fails to stay above the $0.2000 support area.
Ripple price is now back in a bearish zone below $0.2200 against the US Dollar. XRP price is now trading near $0.2000, which holds the key in the near term.
Ripple Price Analysis
In the past two days, there were heavy moves in ripple price from well above $0.2400 against the US Dollar. XRP/USD broke many few key supports near the $0.2240 level to enter a bearish zone.
Moreover, there was a close below the $0.2200 level and the 55 simple moving average (4-hours). There was a break below a major ascending channel with support near $0.2350 on the 4-hours chart of the XRP/USD pair.
The price even broke the $0.2050 support level and traded to a new weekly low at $0.2010. It is currently consolidating losses below $0.2100, with a bearish angle.
An initial resistance is near the $0.2120 level. It is close to the 23.6% Fib retracement level of the recent drop from the $0.2460 high to $0.2010 low. If the price starts a decent recovery above the $0.2100 and $0.2120 levels, it could correct higher towards the $0.2200 area.
The next major resistance is near the $0.2240 level (the previous support). It is also near the 50% Fib retracement level of the recent drop from the $0.2460 high to $0.2010 low.
Therefore, upsides are likely to face a strong selling interest near the $0.2200 and $0.2240 levels. Any further gains could lead the price towards the $0.2350 level and the 55 simple moving average (4-hours).
On the downside, a major support is visible near the $0.2000 area. If the bears are able to clear the $0.2000 support, the price could decline heavily towards the $0.1920 and $0.1850 levels.

Looking at the chart, ripple price is clearly trading in a downtrend below the $0.2200 and $0.2100 levels. It could either start a decent recovery from $0.2000 or extend its decline towards $0.1850 in the near term.
Technical indicators
4 hours MACD – The MACD for XRP/USD is losing momentum in the bearish zone.
4 hours RSI (Relative Strength Index) – The RSI for XRP/USD is now well below the 30 level.
Key Support Levels – $0.2010, $0.2000 and $0.1920.
Key Resistance Levels – $0.2120 and $0.2200.


Leave a Reply
You must be logged in to post a comment.