- Stellar lumen price is down more than 8% and it broke the key $0.0550 support against the US Dollar.
- XLM price is currently consolidating losses near the $0.0500 level.
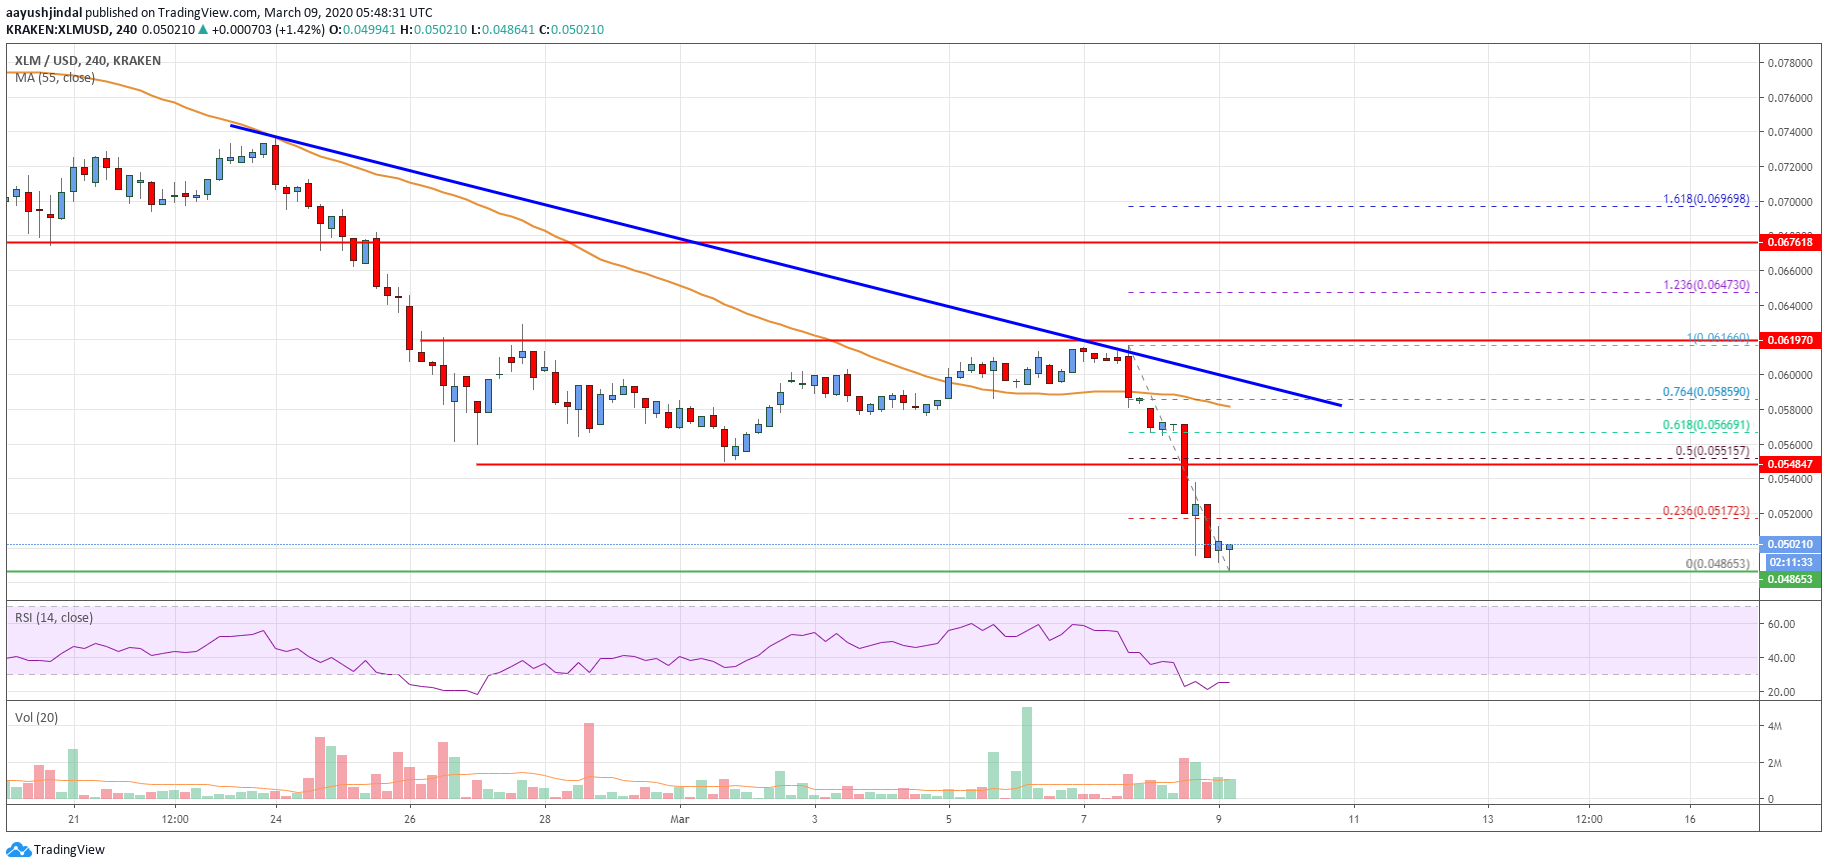
- There is a key bearish trend line forming with resistance near $0.0580 on the 4-hours chart (data feed via Kraken).
- The pair is likely to extend losses if there is a clear break below the $0.0500 support area.
Stellar lumen price is plunging and it broke many key supports against the US Dollar and bitcoin. XLM price could either recovery from $0.0500 or it might dive further towards $0.0450.
Stellar Lumen Price Analysis (XLM to USD)
In the past two days, there were mostly bearish moves in stellar lumen price below the $0.0600 support against the US Dollar. The XLM/USD pair broke the $0.0585 support level and the 55 simple moving average (4-hours) to move into a bearish zone.
Moreover, there was a break below the main $0.0550 support level. The decline was such that the price spiked below the $0.0500 level and a new monthly low is formed near the $0.0486 level.
The price is currently consolidating losses near the $0.0500 level. An initial resistance on the upside is near the $0.0518 level. It coincides with the 23.6% Fibonacci retracement level of the recent drop from the $0.0616 high to $0.0486 low.
If the price starts a decent recovery, it could correct higher towards the $0.0550 resistance level (the previous breakdown zone). The 50% Fibonacci retracement level of the recent drop from the $0.0616 high to $0.0486 low is also near the $0.0550 level.
More importantly, there is a key bearish trend line forming with resistance near $0.0580 on the 4-hours chart. The trend line resistance at $0.0580 is close to the 55 simple moving average (4-hours).
Therefore, the price is likely to face a strong resistance near the $0.0550 and $0.0580 levels if there is an upside correction in the near term.
Conversely, the price could extend its decline below the $0.0500 support level. If the price slides below the $0.0486 low, there is a risk of a drop towards the $0.0450 level.
The chart indicates that XLM price is back in a bearish zone below the $0.0550 pivot level. In the short term, it could correct higher, but upsides are likely to remain capped near the $0.0550 and $0.0580 levels.
Technical Indicators
4 hours MACD – The MACD for XLM/USD is currently recovering in the bearish zone.
4 hours RSI – The RSI for XLM/USD is now correcting higher towards the 35 level.
Key Support Levels – $0.0500 and $0.0450.
Key Resistance Levels – $0.0520, $0.0550 and $0.0580.


Leave a Reply
You must be logged in to post a comment.