- Stellar lumen price declined heavily and it broke the key $0.0630 support area against the US Dollar.
- XLM price is currently testing the $0.0550 support and it could recover in the short term.
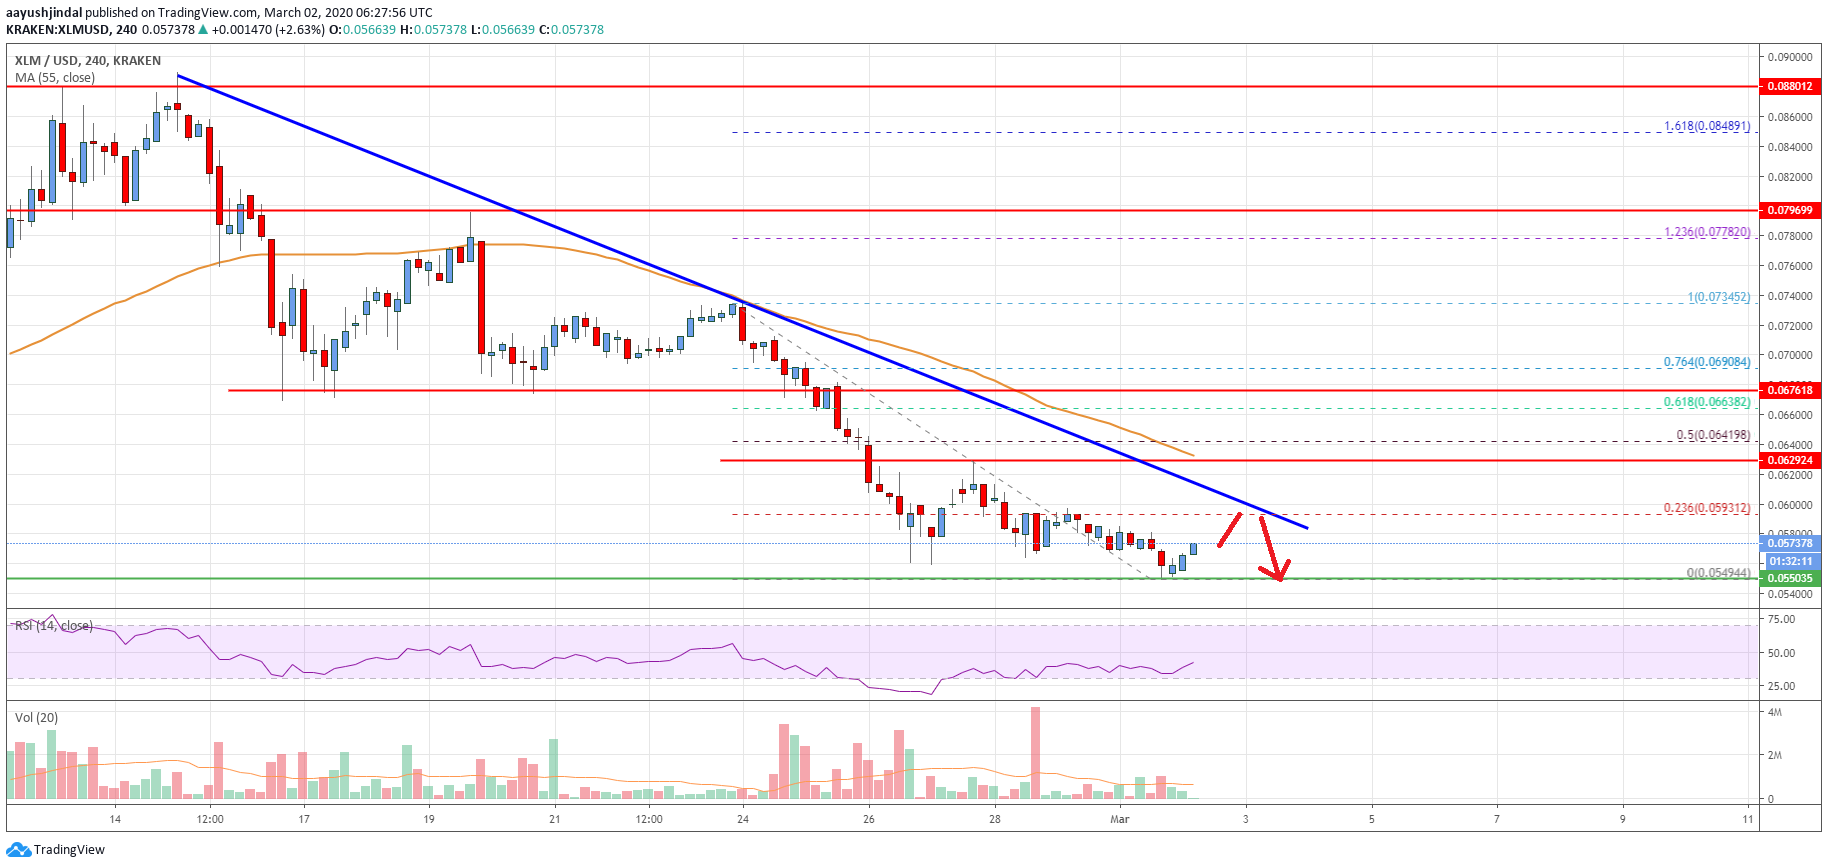
- There is a major bearish trend line forming with resistance near $0.0595 on the 4-hours chart (data feed via Kraken).
- The pair must climb above $0.0595 and $0.0600 to start a strong recovery in the near term.
Stellar lumen price is now trading in a bearish zone against the US Dollar and bitcoin. XLM price might tumble if it struggles to recover above the $0.0600 resistance area.
Stellar Lumen Price Analysis (XLM to USD)
In the past few days, there was a steady decline in stellar lumen price below the $0.0650 and $0.0620 against the US Dollar. The XLM/USD pair even broke the $0.0600 support area and the 55 simple moving average (4-hours).
The decline was such that the pair spiked below $0.0580 and tested the $0.0550 support area. A low is formed near $0.0549 and the price is currently consolidating losses. An initial resistance is near the $0.0592.
The 23.6% Fibonacci retracement level of the recent decline from the $0.0734 high to $0.0549 low is also near the $0.0594 level. Moreover, there is a major bearish trend line forming with resistance near $0.0595 on the 4-hours chart.
Therefore, the price must clear the $0.0595 and $0.0600 resistance levels to initiate a decent recovery in the near term. The next major resistance is also near the $0.0620 level and the 55 simple moving average (4-hours).
The 50% Fibonacci retracement level of the recent decline from the $0.0734 high to $0.0549 low is near the $0.0650 level to act as a key resistance. A successful close above the trend line, $0.0620, and the 55 SMA could open the doors for more gains in the near term.
The next major resistance is near the $0.0675 level. Conversely, the price could fail to recover above the $0.0600 resistance level. In the mentioned case, the price may perhaps resume its decline below the $0.0560 and $0.0550 levels.
The chart indicates that XLM price is facing a lot of hurdles on the upside near $0.0595 and $0.0600. If there is no upside break, the price could start another decline below the $0.0550 support area.
Technical Indicators
4 hours MACD – The MACD for XLM/USD is currently moving in the bearish zone.
4 hours RSI – The RSI for XLM/USD is now recovering towards the 50 level.
Key Support Levels – $0.0560 and $0.0550.
Key Resistance Levels – $0.0695, $0.0600 and $0.0620.


Leave a Reply
You must be logged in to post a comment.