
- Ripple price extended its decline below the $1.00 and $0.80 support levels against the US dollar.
- The price is now trading well below $1.00 and the 55 simple moving average (4-hours).
- There is a key declining channel forming with resistance near the $0.8100 on the 4-hours chart of the XRP/USD pair (data source from Bittrex).
- The pair could start a major recovery if there is a clear break above $0.8100 and $0.8800.
Ripple price is trading in a bearish zone below $1.00 against the US Dollar. XRP price is likely to start a recovery if there is a break above $0.8800.
Ripple Price Analysis
Recently, ripple price extended its decline below the $1.2000 support zone against the US Dollar. The XRP/USD pair even broke the $1.000 support zone and the 55 simple moving average (4-hours).
The bears took control and pushed the price below the $0.8800 and $0.8000 support levels. A low is formed near the $0.6513 level and the price is now correcting higher. It recovered above the $0.7000 and $0.7200 resistance levels.
There was a break above the 23.6% Fib retracement level of the recent decline from the $1.2722 high to $0.6513 low. The price is now consolidating near the $0.8000 resistance.
There is also a key declining channel forming with resistance near the $0.8100 on the 4-hours chart of the XRP/USD pair. If there is an upside break above the channel resistance, the price could rise towards the $0.8800 resistance. The next major resistance is near the $0.9650 level.
The 50% Fib retracement level of the recent decline from the $1.2722 high to $0.6513 low is also near the $0.9650 level. Any more gains could lead the price above the $1.00 level.
Conversely, the price could fail near $0.8000 or $0.8800. In the stated case, the price could decline back towards the $0.6500 level. Any more losses might call for a test of the $0.5000 level.
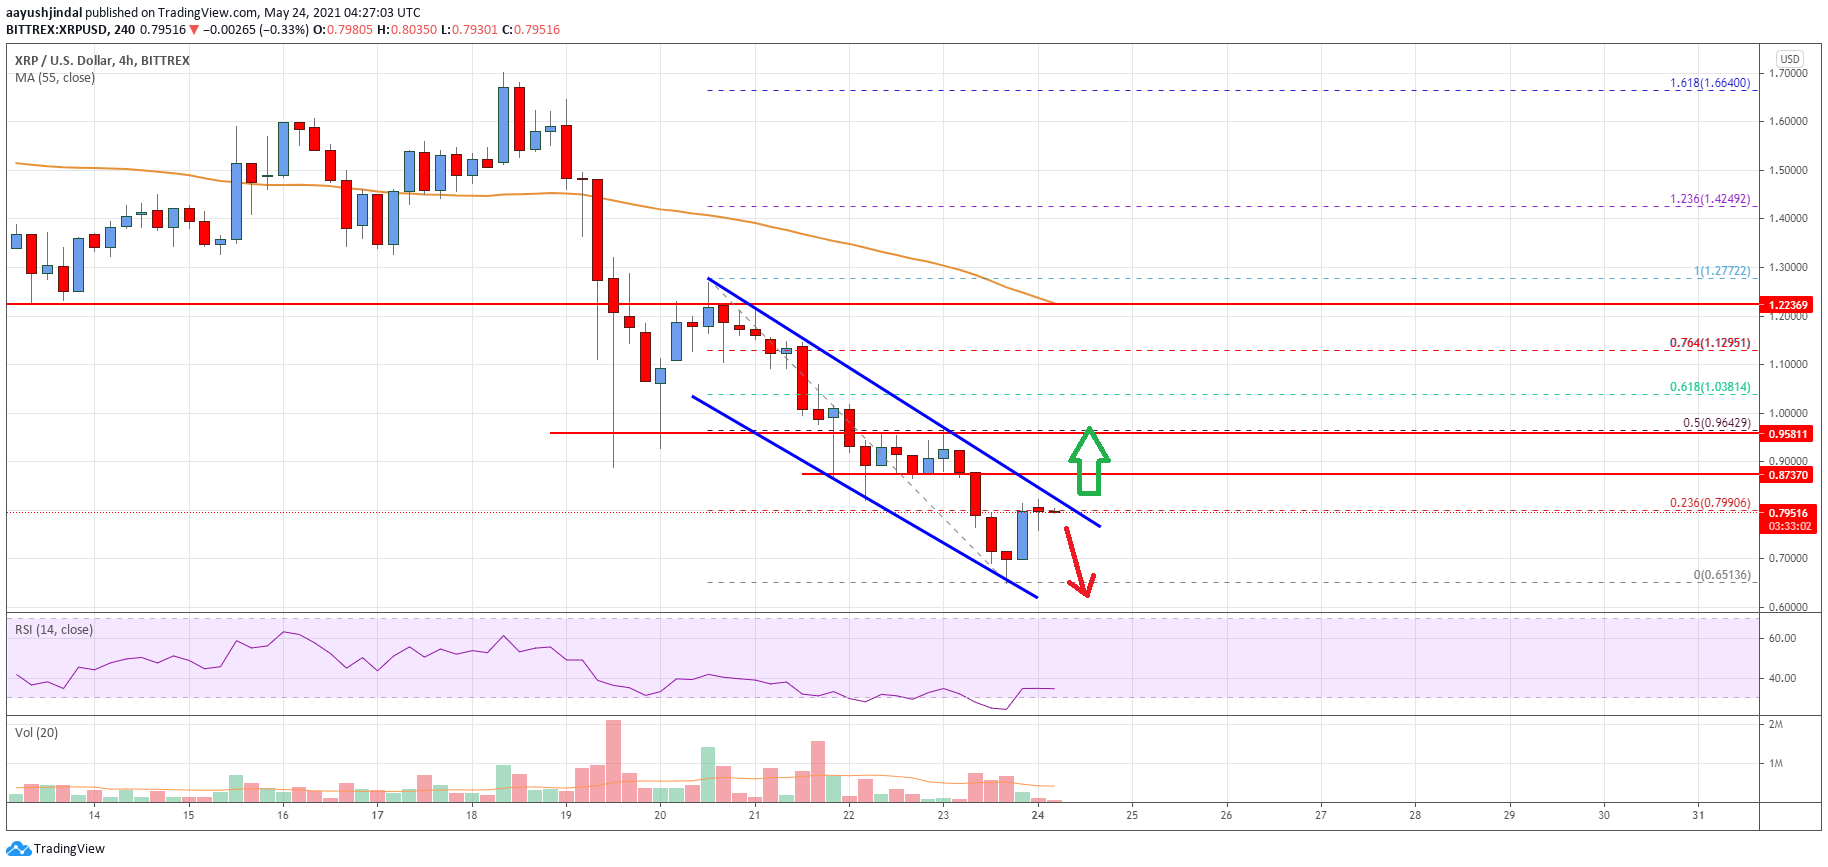
Looking at the chart, ripple price is clearly c trading well below $1.00 and the 55 simple moving average (4-hours). Overall, the price could start a major recovery if there is a clear break above $0.8100 and $0.8800.
Technical indicators
4 hours MACD – The MACD for XRP/USD is now losing momentum in the bearish zone.
4 hours RSI (Relative Strength Index) – The RSI for XRP/USD is now below the 40 level.
Key Support Levels – $0.720, $0.700 and $0.650.
Key Resistance Levels – $0.800 and $0.880.


Leave a Reply
You must be logged in to post a comment.