- Ripple price is holding ground above the $1.22 support zone against the US dollar.
- The price is now consolidating above $1.45 and the 55 simple moving average (4-hours).
- There is a key contracting triangle forming with resistance near the $1.5500 on the 4-hours chart of the XRP/USD pair (data source from Bittrex).
- The pair could start a major increase if there is a clear break above $1.55 and $1.60.
Ripple price is trading nicely above the $1.40 support against the US Dollar. XRP price is likely to accelerate higher if there is a close above $1.55.
Ripple Price Analysis
Recently, ripple price saw a downside correction below the $1.45 support zone against the US Dollar. The XRP/USD pair even spiked below the $1.35 support zone and the 55 simple moving average (4-hours).
However, the price remained stable above the $1.32 support zone. A low was formed near $1.321 before there was a fresh increase. It is now consolidating above $1.45 and the 55 simple moving average (4-hours). The recent high was formed near $1.561 and the price seems to be preparing for the next move.
There is a key contracting triangle forming with resistance near the $1.5500 on the 4-hours chart of the XRP/USD pair. A clear upside break above the triangle resistance could lead the price towards the $1.60 barrier.
Any more gains could open the doors for a larger increase towards the $1.75 resistance. The next major resistance is near the $1.85 level. Conversely, the price might start a fresh decline below the $1.50 level. An initial support is near the $1.45 zone and the 55 simple moving average (4-hours).
The main support is near the triangle at $1.40. A downside break below the $1.40 support may possibly call for a drop towards the $1.22 support zone.
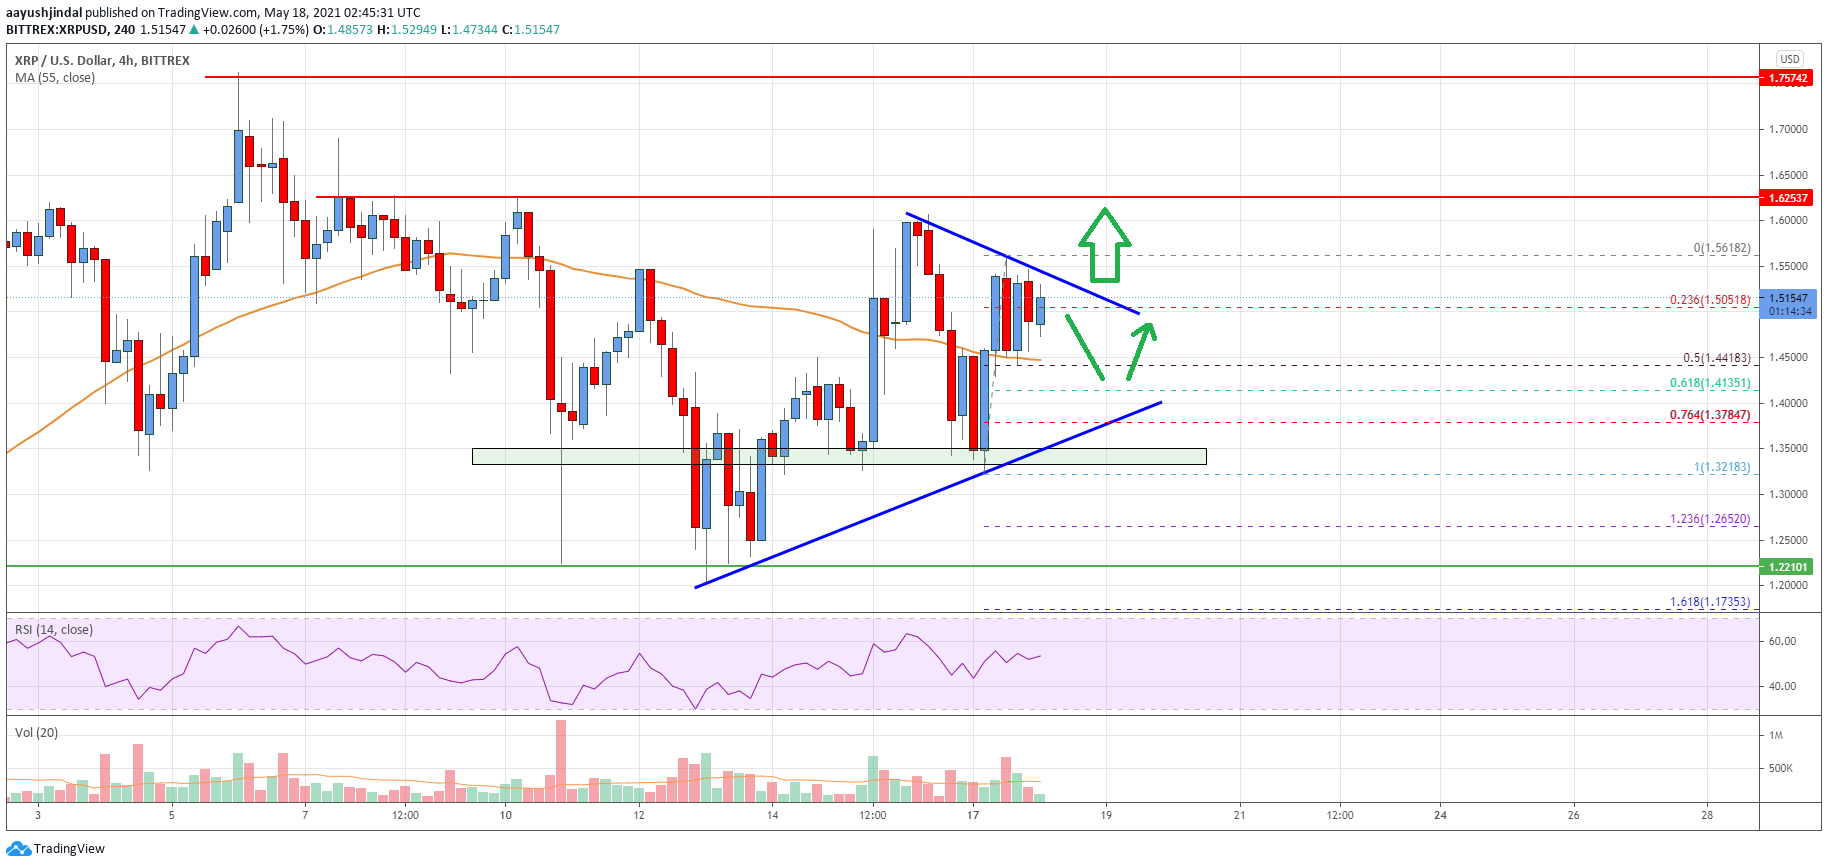
Looking at the chart, ripple price is clearly consolidating above $1.45 and the 55 simple moving average (4-hours). Overall, the price could start a major increase if there is a clear break above $1.55 and $1.60.
Technical indicators
4 hours MACD – The MACD for XRP/USD is slowly gaining momentum in the bullish zone.
4 hours RSI (Relative Strength Index) – The RSI for XRP/USD is now above the 50 level.
Key Support Levels – $1.45, $1.40 and $1.35.
Key Resistance Levels – $1.55 and $1.60.