- Ripple price declined heavily from well above the $0.2500 level against the US dollar.
- The price traded as low as $0.2315 and settled below the 55 simple moving average (4-hours).
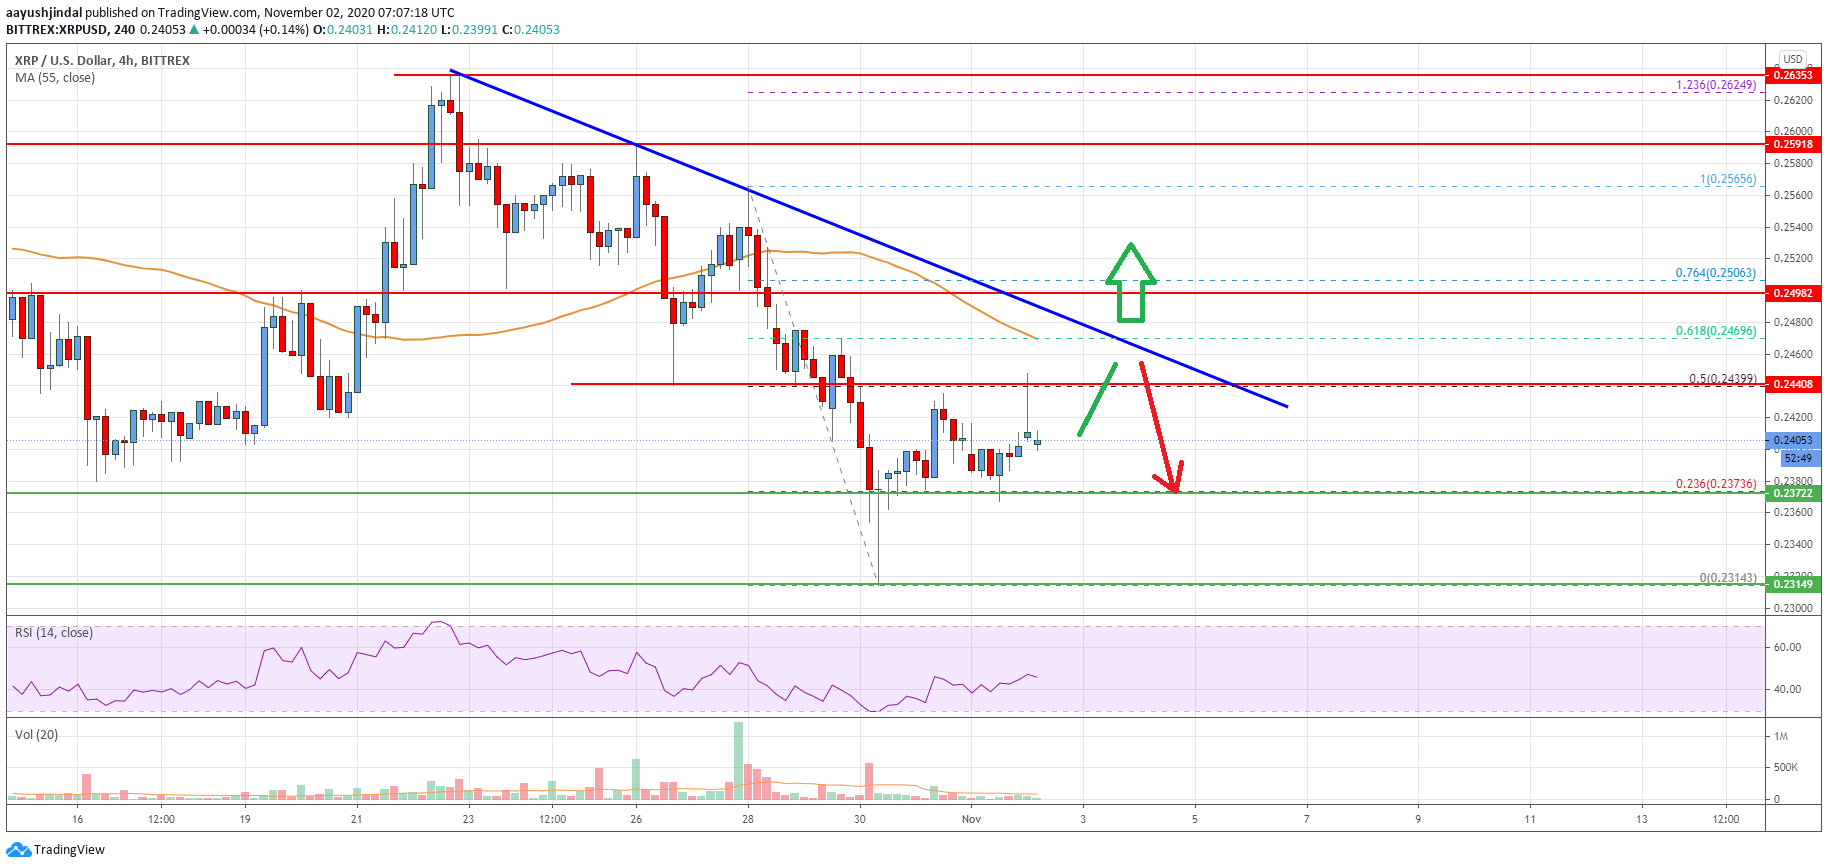
- There is a key bearish trend line forming with resistance near $0.2460 on the 4-hours chart of the XRP/USD pair (data source from Bittrex).
- The pair is likely to start a fresh rally if it clears the $0.2440 and $0.2460 resistance levels.
Ripple price is struggling to gain pace above $0.2425 against the US Dollar. XRP price is likely to start a strong increase once it settled above $0.2460.
Ripple Price Analysis
This past week, there was a strong decline in ripple price from well above the $0.2500 support zone against the US Dollar. The XRP/USD pair declined below the $0.2500 and $0.2440 support level to move into a bearish zone.
There was also a break below the $0.2400 level and the price settled below the 55 simple moving average (4-hours). The pair traded as low as $0.2315 and recently started an upside correction. There was a recovery wave above the $0.2350 level.
The price was able to climb above the 23.6% Fib retracement level of the recent drop from the $0.2565 swing high to $0.2314 swing low. However, the price is now facing a strong resistance near the $0.2440 level.
The 50% Fib retracement level of the recent drop from the $0.2565 swing high to $0.2314 swing low is also acting as a resistance. On the upside, there is also a key bearish trend line forming with resistance near $0.2460 on the 4-hours chart of the XRP/USD pair.
A successful break above the $0.2440 and $0.2460 resistance levels could open the doors for a larger increase. The next hurdle is near the 55 simple moving average (4-hours), above which the price could revisit $0.2550.

Looking at the chart, ripple price is clearly struggling near the $0.2440 resistance level and it is below the 55 simple moving average (4-hours). Therefore, the price is likely to start a fresh rally if it clears the $0.2440 and $0.2460 resistance levels.
Technical indicators
4 hours MACD – The MACD for XRP/USD is moving nicely in the bullish zone.
4 hours RSI (Relative Strength Index) – The RSI for XRP/USD is moving higher towards the 50 level.
Key Support Levels – $0.2400, $0.2385 and $0.2325.
Key Resistance Levels – $0.2440 and $0.2460.


Leave a Reply
You must be logged in to post a comment.