- Ripple price is showing a lot of bearish signs below the $0.3000 level against the US dollar.
- The price is still holding the key $0.2550 support level, but it is well below the 55 simple moving average (4-hours).
- There is a major contracting triangle forming with support near $0.2720 on the 4-hours chart of the XRP/USD pair (data source from Bittrex).
- The pair could start a strong decline if it breaks the $0.2720 and $0.2680 support levels.
Ripple price is struggling to start a decent recovery above $0.3000 against the US Dollar. XRP price could dive below $0.2650 and $0.2550 unless there is a close above $0.3000.
Ripple Price Analysis
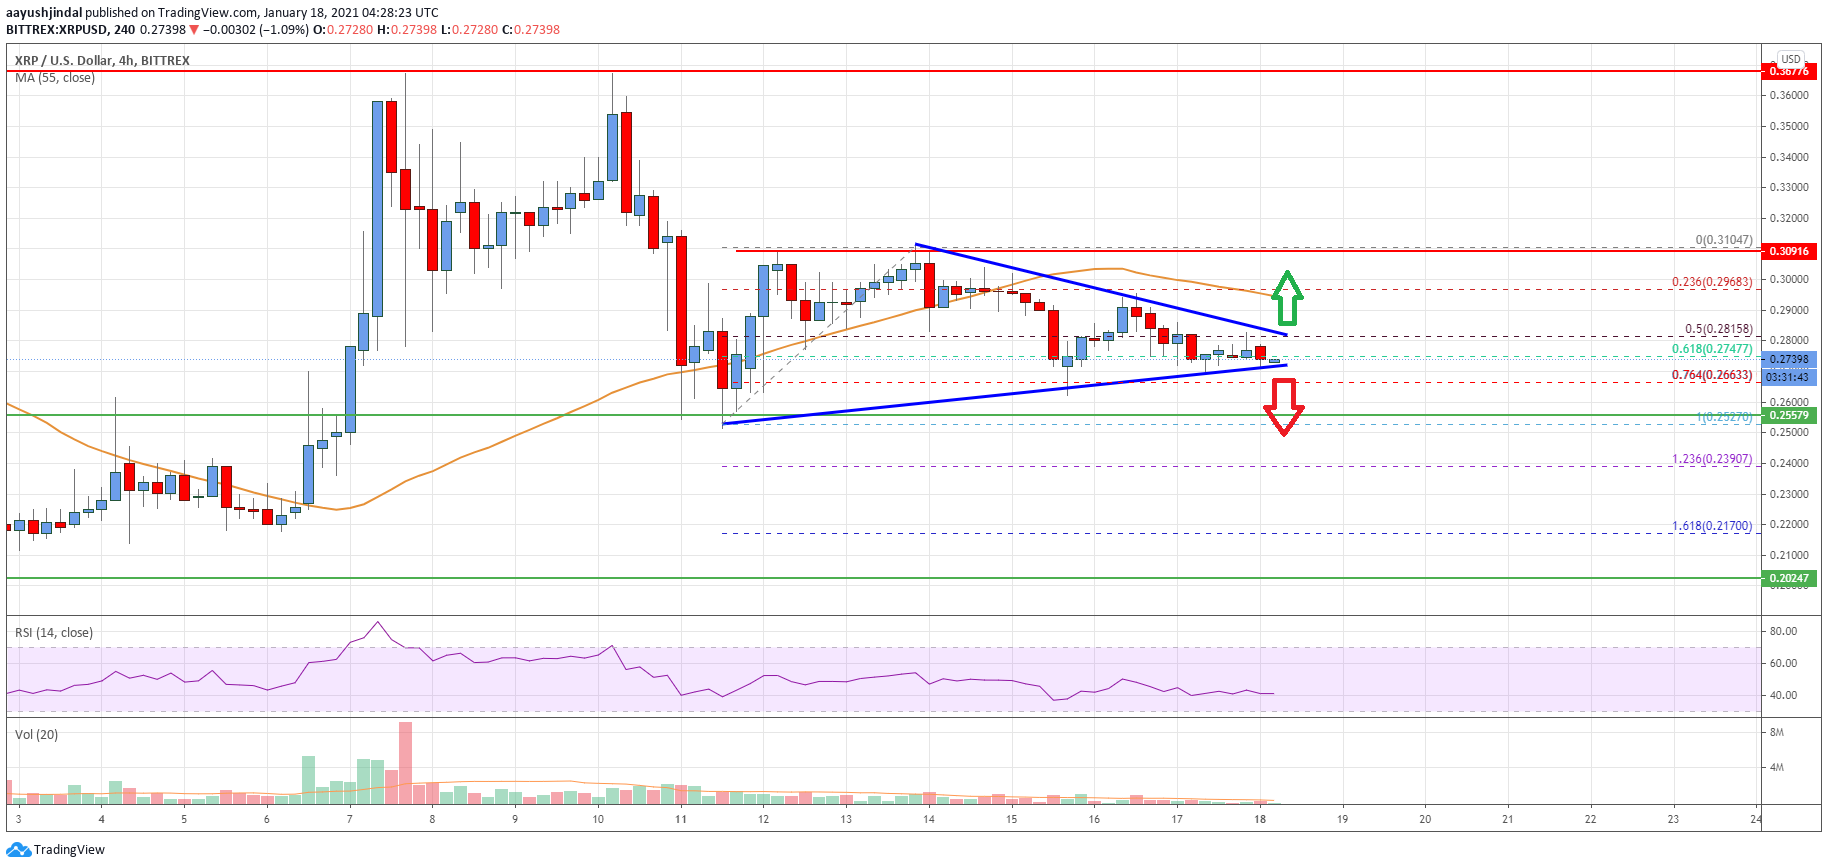
Recently, ripple price made an attempt to settle above $0.3000 against the US Dollar, but it failed. The XRP/USD pair traded as high as $0.3104 and started a fresh decline.
The pair broke many important hurdles near $0.2950 and $0.2880 to move into a bearish zone. There was also a break below the 50% Fib retracement level of the upward move from the $0.2527 swing low to $0.3104 high.
The price is now trading well below the $0.3000 level and the 55 simple moving average (4-hours). There is also a major contracting triangle forming with support near $0.2720 on the 4-hours chart of the XRP/USD pair. The triangle support is close to the 61.8% Fib retracement level of the upward move from the $0.2527 swing low to $0.3104 high.
If there is a downside break below the triangle support and $0.2650, the price could continue to move down towards the main $0.2550 support. Any more losses might start a sustained decline towards the $0.2000 and $0.1800 levels.
Conversely, the price could break the triangle resistance at $0.2815 to start a steady increase. The next major resistance is near the $0.3000 level and the 55 simple moving average (4-hours).
To start a strong increase and recovery, the price must settle above $0.3000, the 55 simple moving average (4-hours), and the $0.3100 zone.
Looking at the chart, ripple price is clearly trading in a bearish zone below the $0.3000 pivot level and the 55 simple moving average (4-hours). Overall, the price could start a strong decline if it breaks the $0.2720 and $0.2680 support levels.
Technical indicators
4 hours MACD – The MACD for XRP/USD is currently gaining momentum in the bearish zone.
4 hours RSI (Relative Strength Index) – The RSI for XRP/USD is now well below the 50 level.
Key Support Levels – $0.2720, $0.2650 and $0.2550.
Key Resistance Levels – $0.3000 and $0.3100.
