- Ripple price failed to trade above the $0.3400 resistance and declined recently against the US dollar.
- Sellers pushed the price below the $0.3155 support and the 55 simple moving average (4-hours).
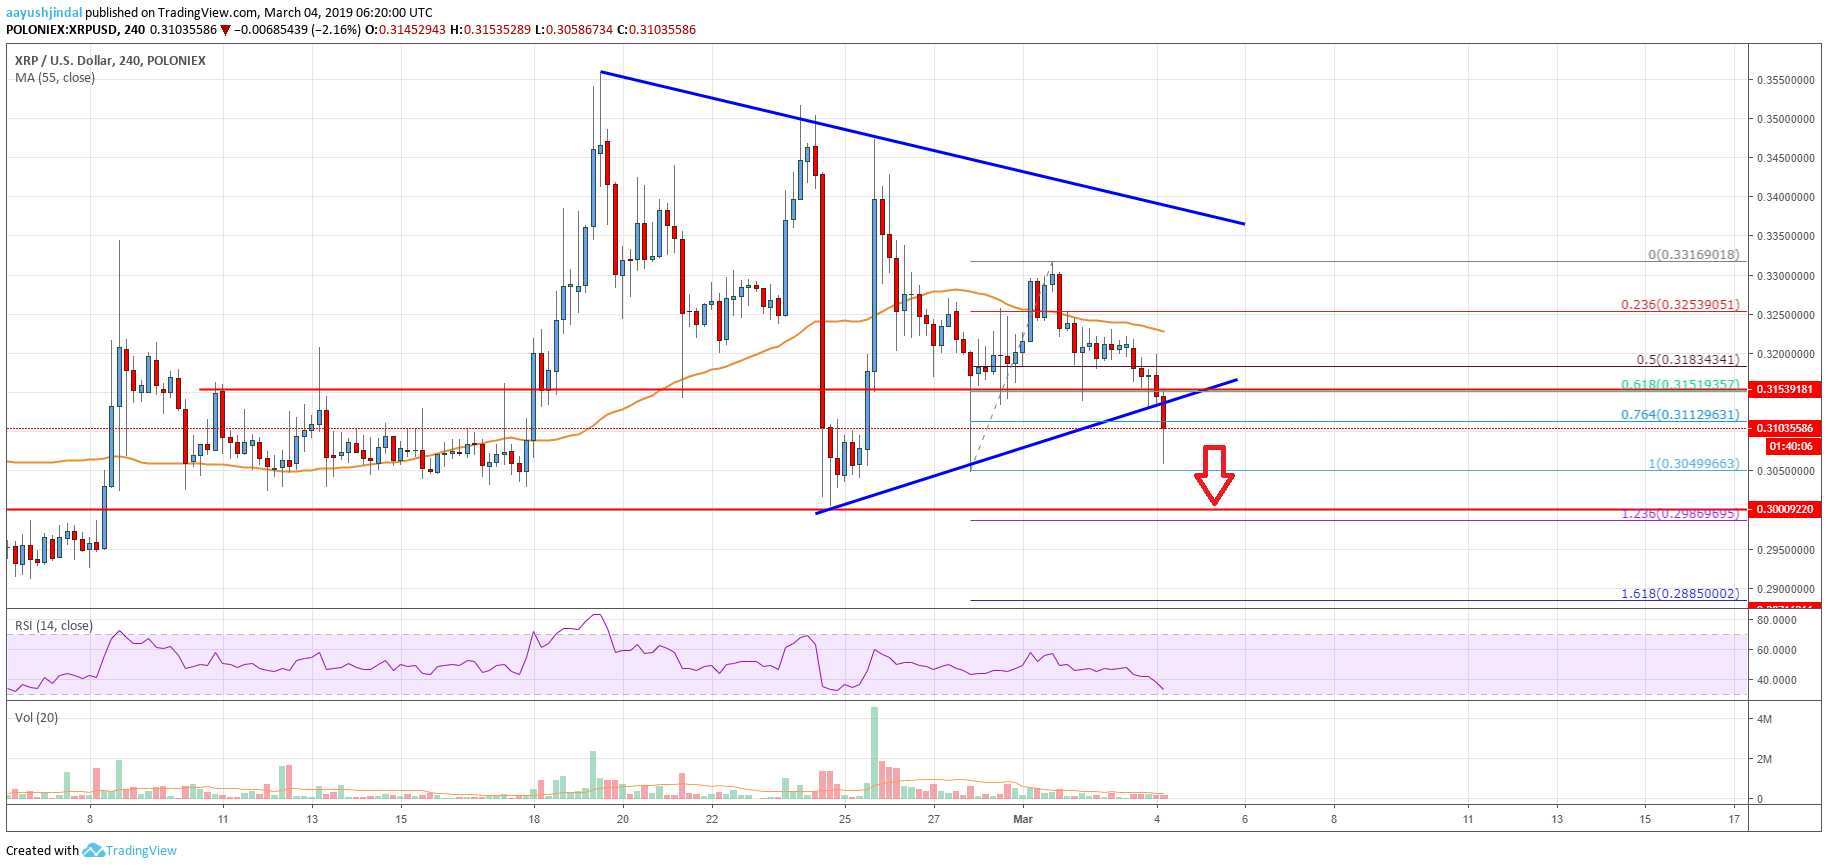
- There was a break below a major contracting triangle with support at $0.3155 on the 4-hours chart of the XRP/USD pair (data source from Poloniex).
- The price is now at a risk of extended losses towards the $0.3000 or $0.2880 support level.
Ripple price declined below the key $0.3155 support level against the US Dollar. XRP could continue to move down and it is likely to retest the $0.3000 support before attempting a recovery.
Ripple Price Analysis
In the past few sessions, there was an increase in selling on bitcoin, Ethereum, bitcoin cash, eos and ripple against the US Dollar. The XRP/USD pair failed to trade above the $0.3400 resistance and declined recently below $0.3250. The pair gained bearish momentum and settled below $0.3200 plus the 55 simple moving average (4-hours). The recent decline was strong as the price cleared a crucial support area near the $0.3155 level. Besides, there was a break below the 61.8% Fib retracement level of the last wave from the $0.3049 low to $0.3316 high.
Finally, there was a break below a major contracting triangle with support at $0.3155 on the 4-hours chart of the XRP/USD pair. The pair is now trading below $0.3120 and the 76.4% Fib retracement level of the last wave from the $0.3049 low to $0.3316 high. Therefore, there is a risk of more losses towards the last swing low at $0.3049. However, the main support is near the 0.3000 level.
In an ideal case, the price could test the 1.236 Fib extension level of the last wave from the $0.3049 low to $0.3316 high at $0.2986. On the other hand, if there is an upside correction, the price could face sellers near $0.3140 and $0.3155. The key barrier for buyers is near $0.3220 and the 55 simple moving average (4-hours).

Looking at the chart, ripple price is slowly moving towards the $0.3000 support area, where buyers are likely to emerge. If XRP fails to stay above $0.3000 or $0.2980, there is a risk of more losses towards the $0.2880 support area. On the other hand, a successful close above $0.3155 and $0.3220 could open the doors for a fresh increase in the coming days.
Technical indicators
4 hours MACD – The MACD for XRP/USD is placed heavily in the bearish zone, with a negative bias.
4 hours RSI (Relative Strength Index) – The RSI for XRP/USD dipped sharply below the 40 level and it could test 30.
Key Support Levels – $0.3045, $0.3000 and $0.2980.
Key Resistance Levels – $0.3155 and $0.3220.


Leave a Reply
You must be logged in to post a comment.