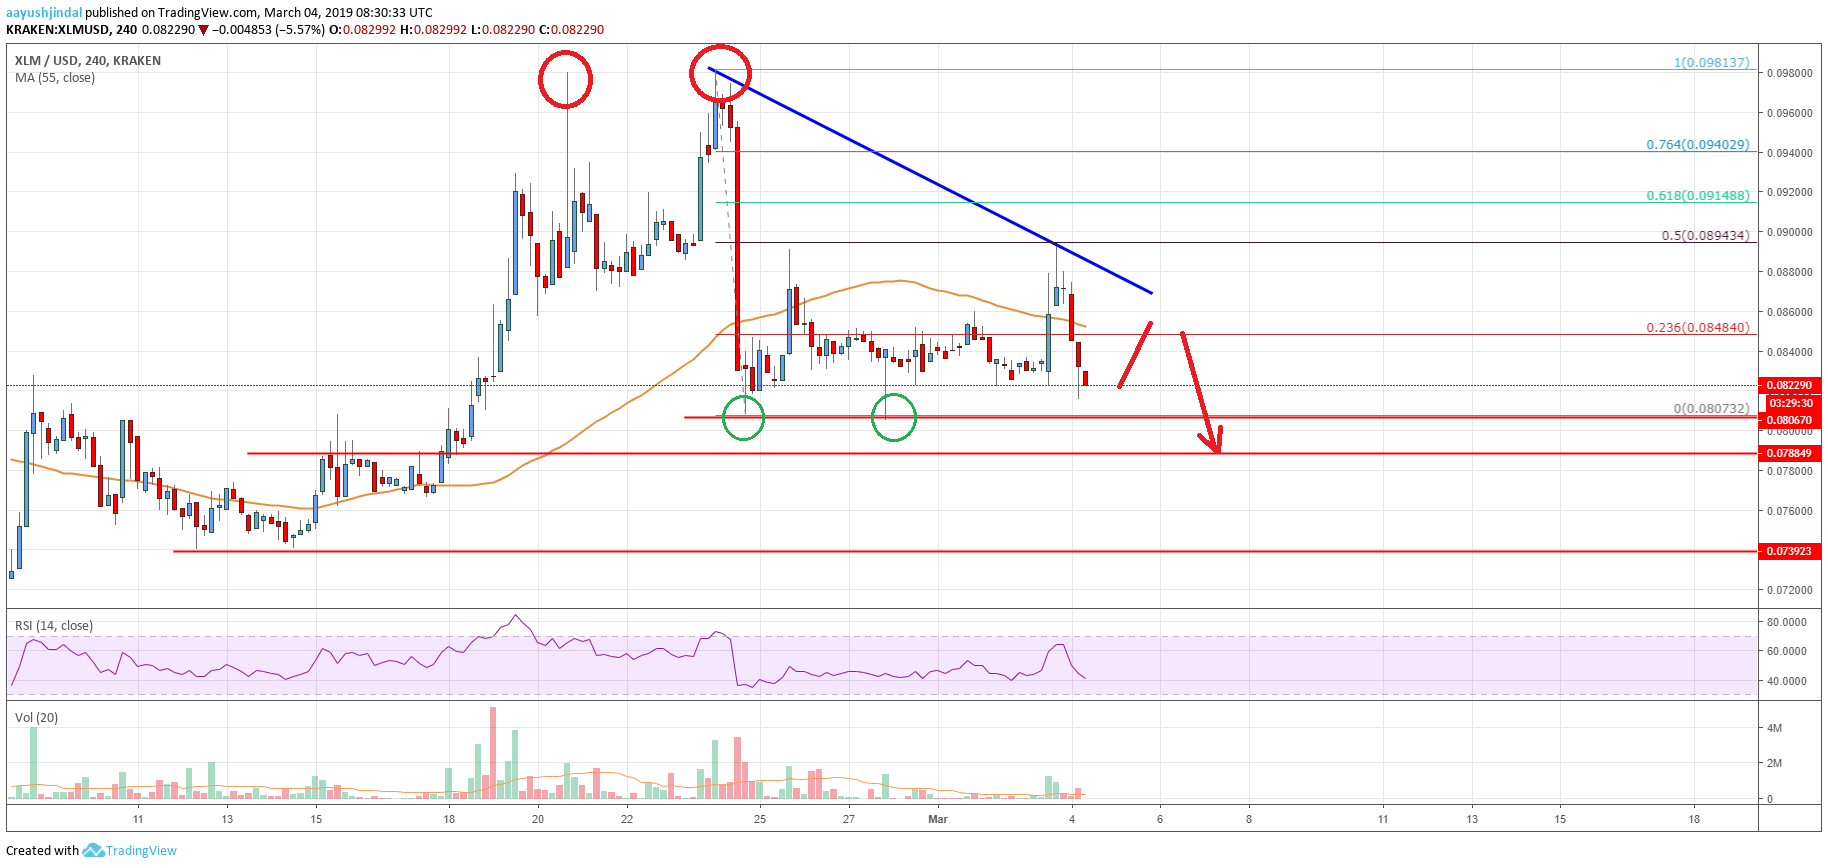
- Stellar lumen price is facing a strong resistance near the $0.0900 level against the US Dollar.
- XLM price could break the $0.0800 support and decline sharply in the near term.
- There is a major bearish trend line in place with resistance at $0.0870 on the 4-hours chart (data feed via Kraken).
- If there is a break below $0.0800, the price could test the $0.0740 support area in the near term.
Stellar lumen price was stable as compared to bitcoin and Ethereum against the US Dollar. However, a downside break below the $0.0800 support in XLM could spark heavy bearish moves.
Stellar Lumen Price Analysis (XLM to USD)
There was a strong upward move in stellar lumen price above the $0.0900 resistance in Feb 2019 against the US Dollar. The XLM/USD pair broke many important resistances such as $0.0920 and $0.0950. However, the price failed to clear the $0.0980 and $0.1000 resistance levels. There were two attempts to clear the $0.0980 resistance, but buyers failed. As a result, there was a strong downside reaction and the price declined below the $0.0950 support.
The decline was such that the price settled below the $0.0900 support and the 55 simple moving average (4-hours). Finally, the price broke the $0.0840 support and a low was formed at $0.0807. Recently, the price recovered above $0.0840 and the 23.6% Fibonacci retracement level of the last decline from the $0.0981 high to $0.0807 low. However, the recovery was capped by the $0.0900 resistance area. Besides, the price failed near the 50% Fibonacci retracement level of the last decline from the $0.0981 high to $0.0807 low.
There was a fresh decline below $0.0840 and the 55 simple moving average (4-hours). At the outset, the price is approaching the last swing low at $0.0807. The main support is at $0.0800, below which the price could decline sharply towards the $0.0740 support area. On the upside, an initial resistance is near the $0.0840 level. There is also a major bearish trend line in place with resistance at $0.0870 on the 4-hours chart.

The chart indicates that XLM price is approaching the next crucial break either below $0.0807 or above $0.0870. As long as the price is struggling below $0.0890, there is a risk of a breakdown below $0.0807. The key supports to watch are $0.0800, $0.0780 and $0.0740. The final stop for sellers could be $0.0720.
Technical Indicators
4 hours MACD – The MACD for XLM/USD is currently gaining momentum in the bearish zone.
4 hours RSI – The RSI for XLM/USD is moved down sharply below the 50 level, with a strong bearish angle.
Key Support Levels – $0.0807 and $0.0800
Key Resistance Levels – $0.0840, $0.0860 and $0.0870.


Leave a Reply
You must be logged in to post a comment.