- Ripple price spiked on a couple of occasions above the $0.3280 resistance area against the US dollar.
- There was no proper 4-hour close above the $0.3300 and $0.3325 resistance levels.
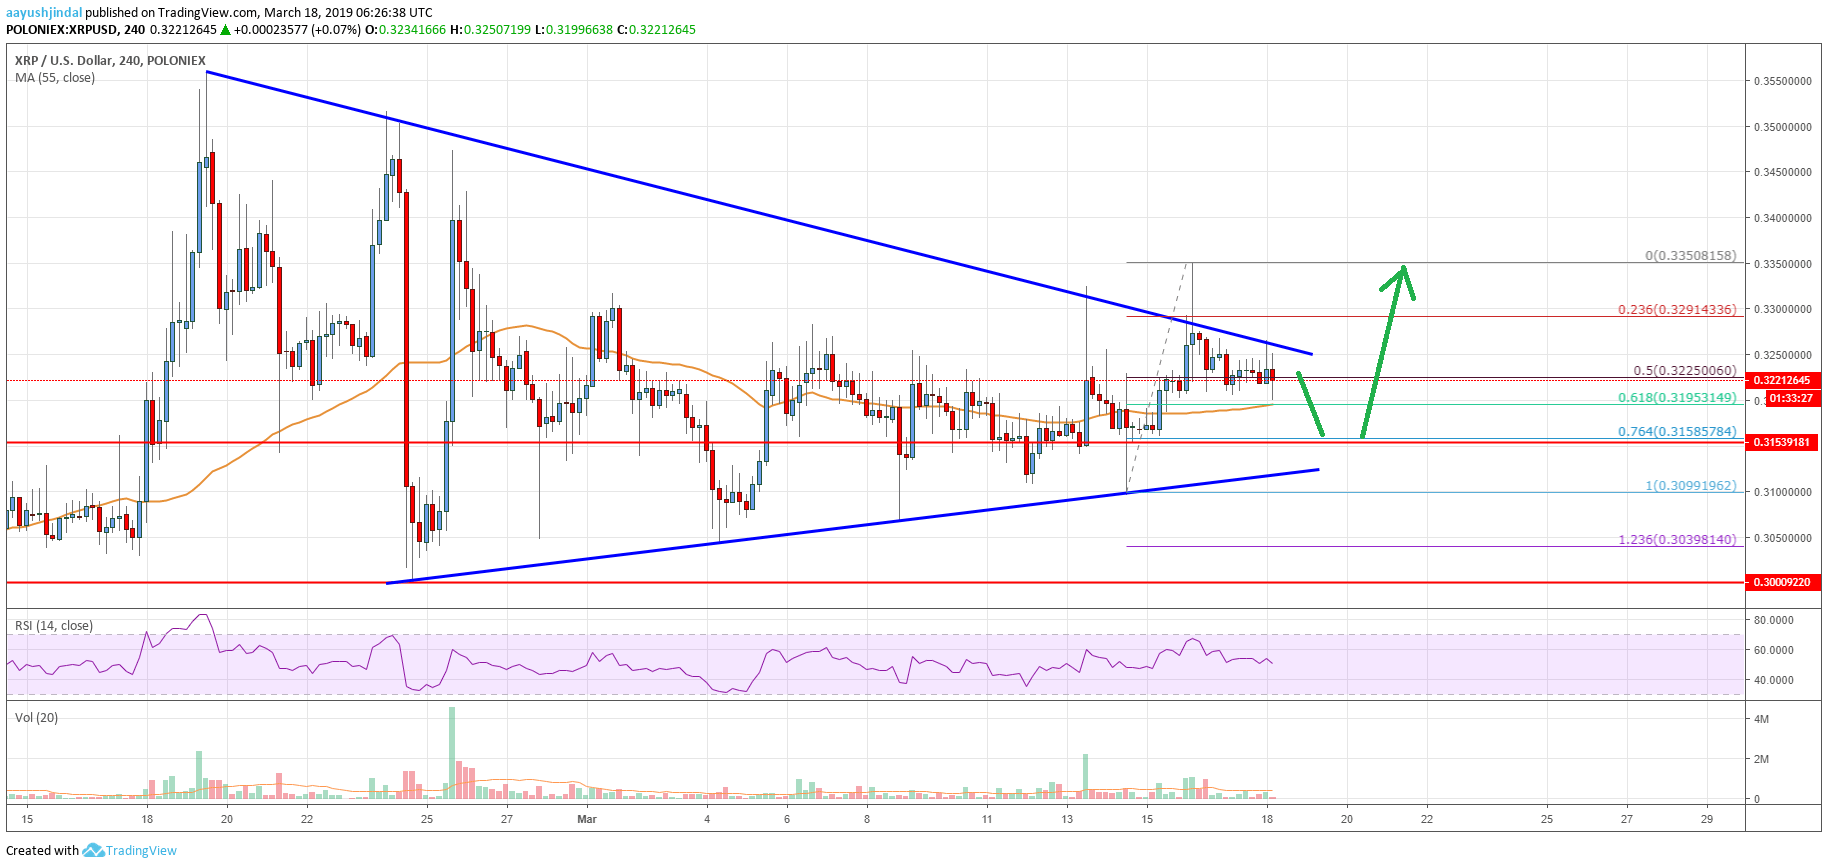
- There is a crucial contracting triangle formed with resistance near $0.3250 and $0.3260 on the 4-hours chart of the XRP/USD pair (data source from Poloniex).
- The price is likely to surge higher once there is a proper close above $0.3250 and $0.3300.
Ripple price remained confined in a broad range against the US Dollar. XRP is likely preparing for the next significant break either above $0.3300 or below $0.3100.
Ripple Price Analysis
This past week, we saw a decent rise in bitcoin, Ethereum, bitcoin cash, eos and ripple against the US Dollar. The XRP/USD pair also gained traction and climbed above the $0.3220 resistance level. There was a clear break above the $0.3250 resistance and the 55 simple moving average (4-hours). The price even spiked on a couple of occasions above the $0.3280 resistance area. However, buyers failed to keep the price above the $0.3300 level and a high was formed at $0.3350.
Later, there was a downside correction below the $0.3300 level. Sellers pushed the price below the 23.6% Fib retracement level of the last wave from the $0.3099 low to $0.3350 high. However, the $0.3200 support and the 55 simple moving average (4-hours) acted as a support. More importantly, there is a crucial contracting triangle formed with resistance near $0.3250 and $0.3260 on the 4-hours chart of the XRP/USD pair. The pair is currently trading just below the triangle resistance at $0.3250, with a positive bias.
Buyers need to push the price above the $0.3250 and $0.3260 resistance levels. Besides, a proper close above the $0.3300 is needed for a convincing upside break. In the mentioned bullish case, the price could rally above $0.3320 and $0.3350 in the near term. On the downside, an initial support is at $0.3200 and 55 simple moving average (4-hours). The main support is near the triangle trend line and $0.3100.

Looking at the chart, ripple price is clearly approaching the next significant break either above $0.3300 or below $0.3100. A downside break below the $0.3100 support won’t be easy. Therefore, there are high chances of an upside break above $0.3250 and $0.3300 in the near term. Buyers could even target $0.3500 and $0.3600 once there is a close above $0.3300.
Technical indicators
4 hours MACD – The MACD for XRP/USD is currently flat in the bullish zone, with a neutral bias.
4 hours RSI (Relative Strength Index) – The RSI for XRP/USD is slowly moving lower towards the 50 level.
Key Support Levels – $0.3200, $0.3140 and $0.3100.
Key Resistance Levels – $0.3250 and $0.3300.


Leave a Reply
You must be logged in to post a comment.