- Ripple price stayed above the $0.3025 and $0.3050 support levels against the US dollar.
- The last week’s highlighted crucial bearish trend line is intact with resistance at $0.3300 on the 4-hours chart of the XRP/USD pair (data source from Poloniex).
- It seems like the pair is forming a breakout pattern with resistance at $0.3350 and support near $0.3000.
- High chances of an upside break as long as the price is above the $0.3000 support area.
Ripple price is currently trading in a broad range above $0.3000 against the US Dollar. XRP is likely forming a major breakout pattern, with resistances near $0.3300 and $0.3350.
Ripple Price Analysis
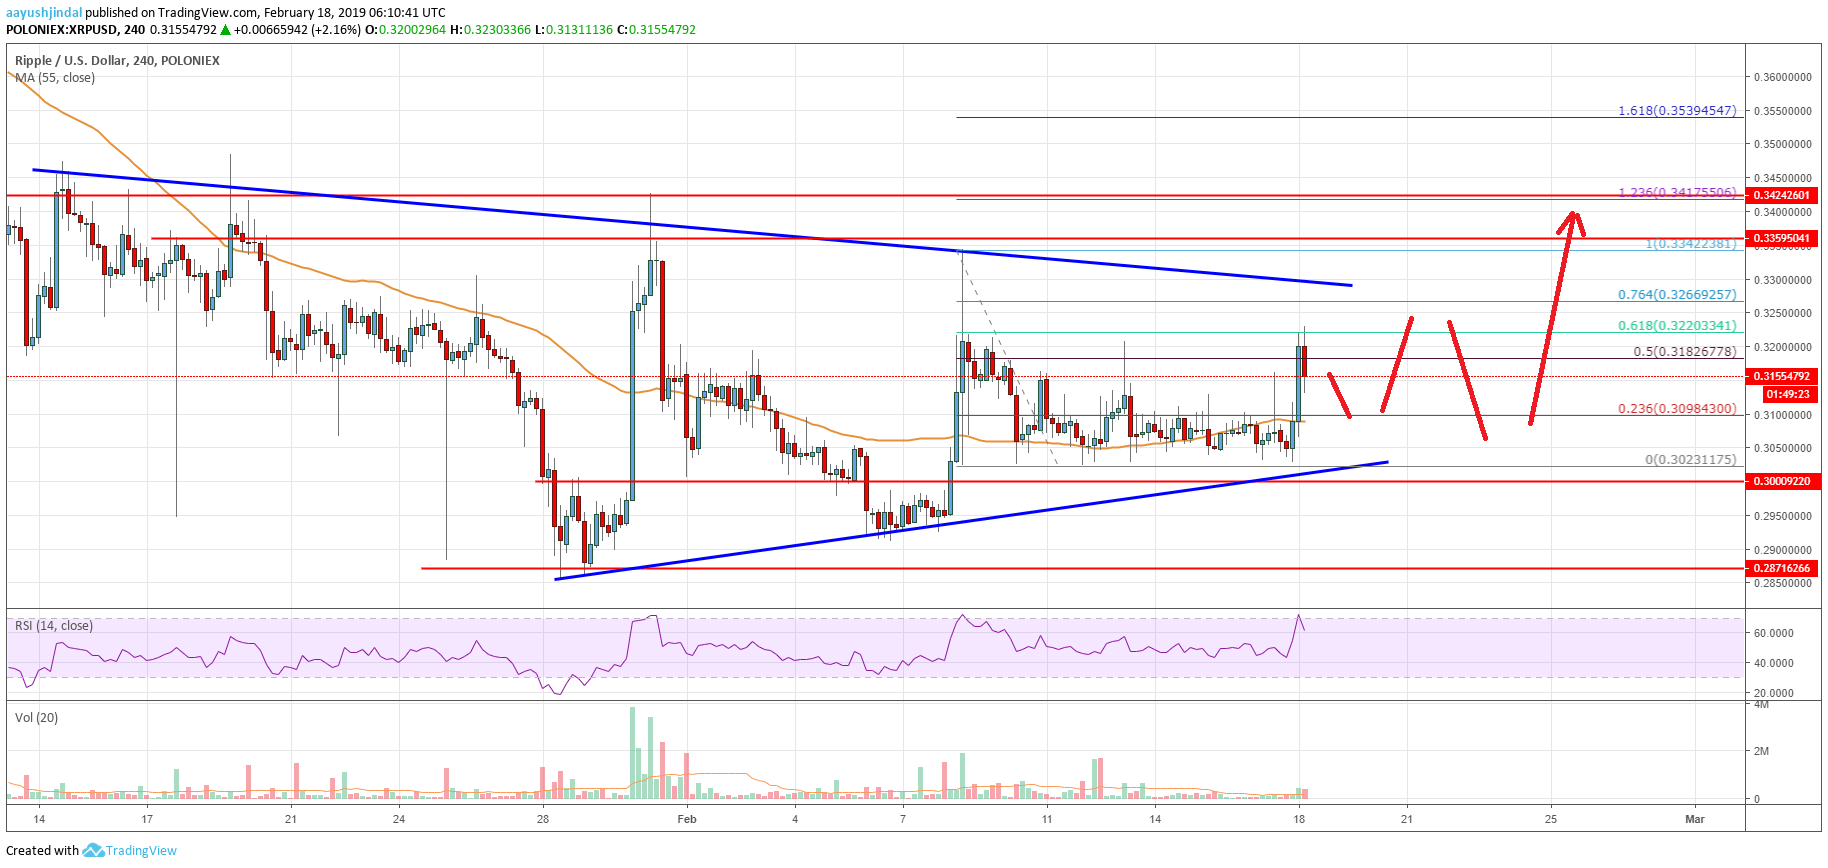
In the past two days, there were decent gains in bitcoin, Ethereum, bitcoin cash, eos and ripple price against the US Dollar. More importantly, the XRP/USD pair stayed above the $0.3025 and $0.3050 support levels. A swing low was formed at $0.3023 and later the pair started a fresh upward move. It broke the $0.3080 resistance to start a recovery. Buyers gained traction above the $0.3095 resistance and the 55 simple moving average (4-hours). Finally, there was a break above the 50% Fib retracement level of the last decline from the $.3342 high to $0.3023 low.
However, the price faced a strong resistance near the $0.3220 and $0.3225 levels. The 61.8% Fib retracement level of the last decline from the $.3342 high to $0.3023 low also prevented gains. Above $0.3225, the next key resistance is near the $0.3300 zone. Besides, the last week’s highlighted crucial bearish trend line is intact with resistance at $0.3300 on the 4-hours chart of the XRP/USD pair. Therefore, it won’t be easy for buyers to clear the $0.3300 resistance area.
The key resistance is near $0.3350, above which buyers are likely to take control. Should there be a proper close above $0.3000 and $0.3350, the price could rally towards the $0.3500 and $0.4000 resistance levels in the near term. On the downside, an initial support is near the $0.3090 level and the 55 simple moving average (4-hours). The key support is at $0.3000, below which the price may move into a bearish zone.

Looking at the chart, ripple price seems to be forming a breakout pattern with resistance at $0.3350 and support near $0.3000. In the short term, there could be extended range moves before the price makes the next move either above $0.3350 or below $0.3000.
Technical indicators
4 hours MACD – The MACD for XRP/USD is currently placed nicely in the bullish zone.
4 hours RSI (Relative Strength Index) – The RSI for XRP/USD tested the 70 area and it is currently correcting lower.
Key Support Levels – $0.3090, $0.3065 and $0.3000.
Key Resistance Levels – $0.3300 and $0.3350.


Leave a Reply
You must be logged in to post a comment.