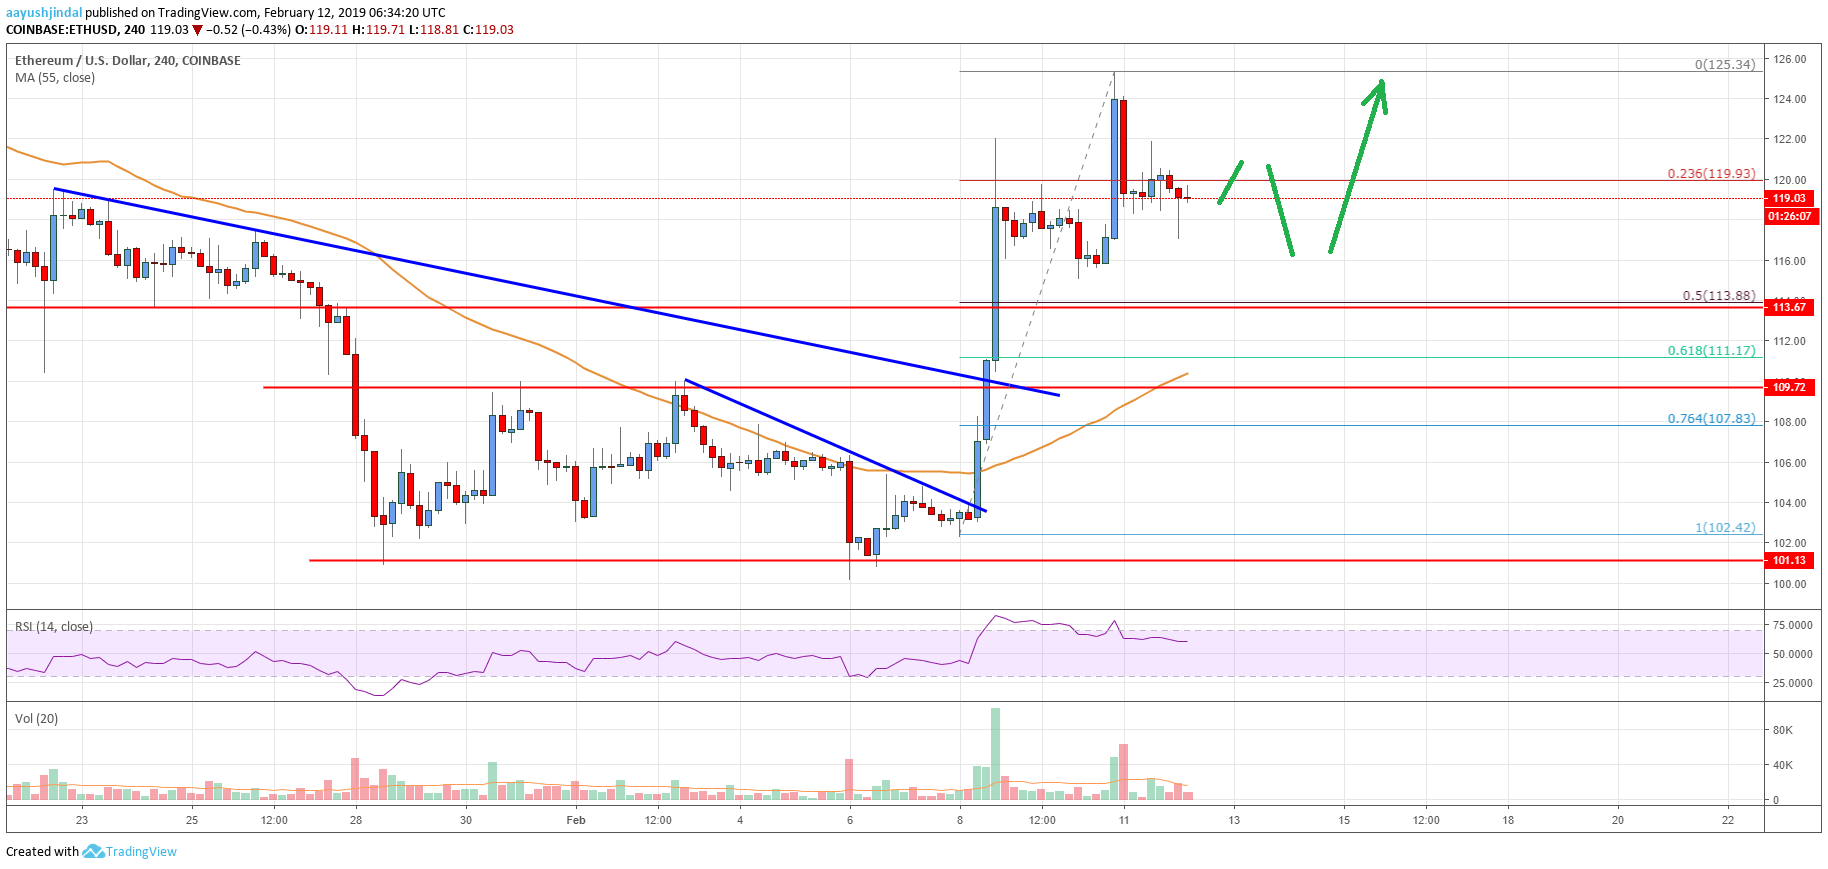
- Ethereum price rallied recently and broke the $109 and $113 resistances against the US Dollar.
- ETH surpassed a crucial bearish trend line with resistance near $109 on the 4-hours chart (data feed from Coinbase).
- The price gained traction, traded as high as $125, and it is currently correcting lower.
Ethereum price jumped sharply into a bullish above $113 against the US Dollar. ETH remains supported on dips and it could continue to move higher towards $125 and $130.
Ethereum Price Analysis
After forming a strong support base near the $100 level, Ethereum price started a sharp rally against the US Dollar. The ETH/USD pair broke many resistances near the $109-110 zone to enter a bullish zone. There was even a close above the $110 level and the 55 simple moving average (4-hours). More importantly, the price settled above the key resistance area near $113-114, which acted as a strong barrier on many occasions.
Besides, there was a break above a crucial bearish trend line with resistance near $109 on the 4-hours chart. The pair climbed above the $120 level and tested the $125 resistance level. Later, there was a downside correction below the $122 level. The price declined below the 23.6% Fib retracement level of the last wave from the $102 swing low to $125 high. However, there are many supports on the downside near the $116 and $114 levels. The main support is near $113-114, which was a resistance earlier. It also coincides with the 50% Fib retracement level of the last wave from the $102 swing low to $125 high. Therefore, dips towards the $116 and $114 levels are likely to find a strong buying interest.

Looking at the chart, Ethereum price is clearly trading in a bullish zone above $114. On the upside, an initial resistance is at $12, above which the price could retest the $125 resistance. The next key hurdle for buyers is near the $130 level.
Technical indicators
4-hours MACD – The MACD for ETH/USD is placed nicely in the bullish zone.
4-hours RSI (Relative Strength Index) – The RSI for ETH/USD is slowly moving lower towards the 50 level.
Key Support Level – $114
Key Resistance Level – $125


Leave a Reply
You must be logged in to post a comment.