- Ripple price rallied recently, but it failed near a crucial resistance at $0.3340 against the US dollar.
- There is a significant bearish trend line formed with resistance at $0.3320 on the 4-hours chart of the XRP/USD pair (data source from Poloniex).
- The pair could continue to struggle as long as it is trading below $0.3300 and $0.3340.
Ripple price climbed higher, but failed to break a major resistance near $0.3320 against the US Dollar. XRP trimmed most its gains and traded towards the $0.3000 support area.
Ripple Price Analysis
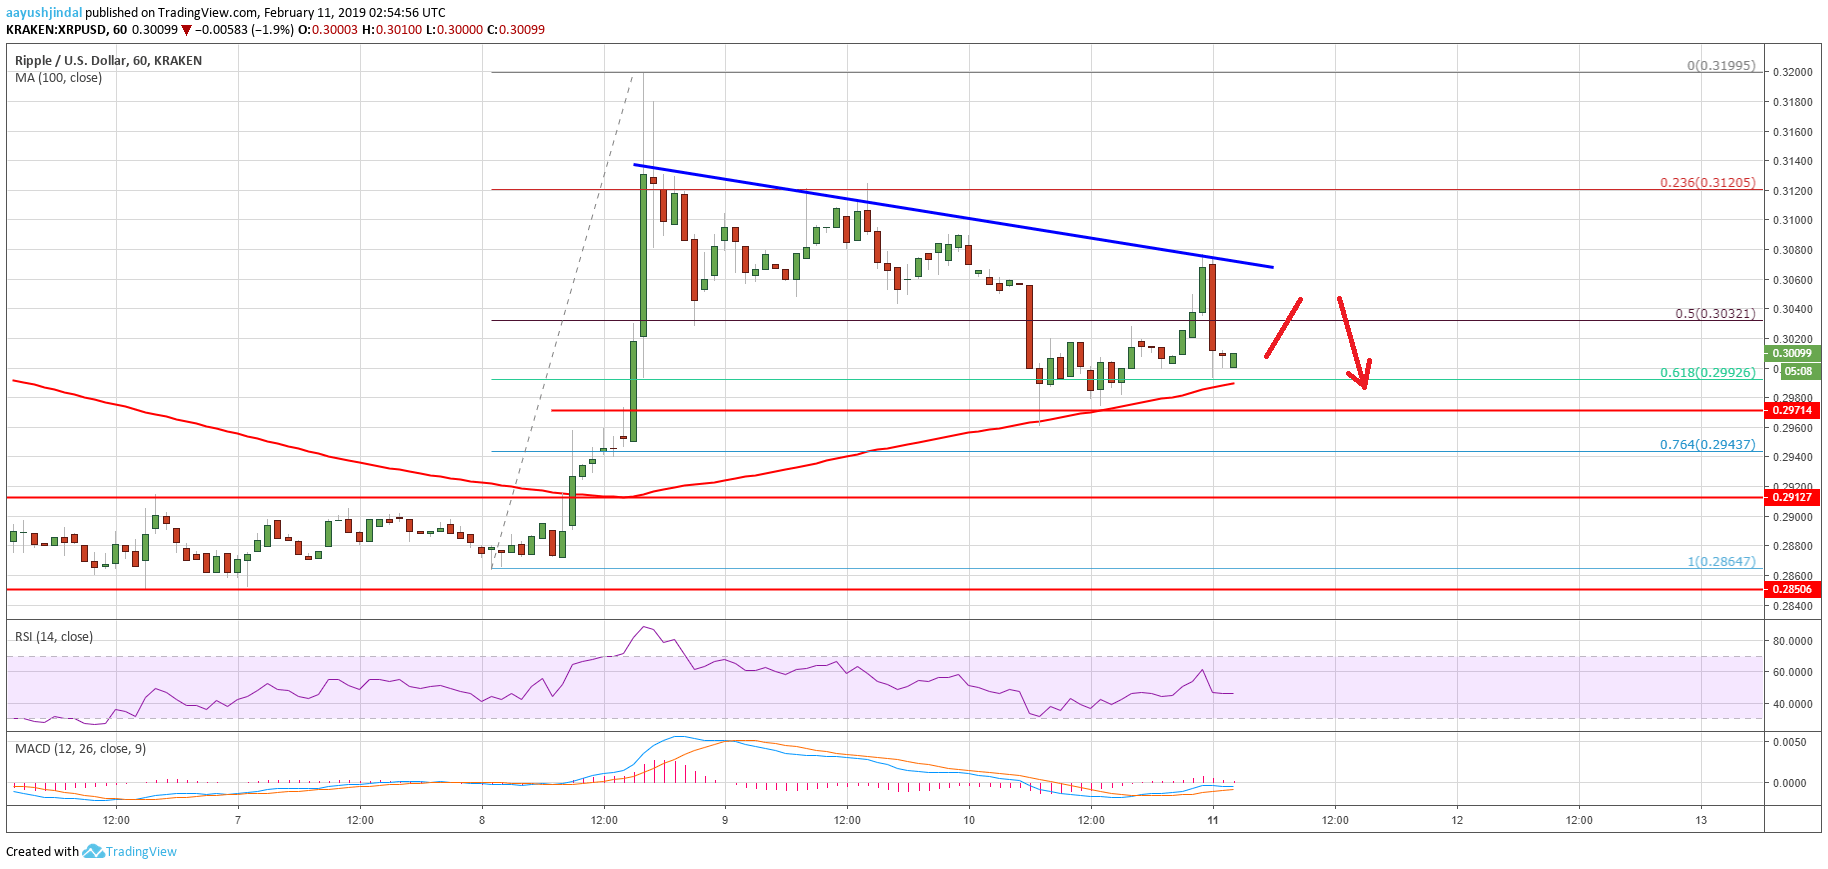
In the past few days, there was a solid bullish wave in bitcoin, Ethereum, bitcoin cash, eos and ripple price against the US Dollar. The XRP/USD pair climbed above the $0.3080 and $0.3200 resistance levels. There was even a break above the $0.3250 resistance and a close above the 55 simple moving average (4-hours). However, the price failed near a crucial resistance at $0.3340. The price topped near the $0.3340 level and later started a fresh decline. It trimmed most its gains and traded below the $0.3250 and $0.3200 levels.
There was a break below the 61.8% Fib retracement level of the last wave from the $0.2926 low to $0.3342 high. However, the price found support near the $0.3020 level and the 55 simple moving average (4-hours). Moreover, the 76.4% Fib retracement level of the last wave from the $0.2926 low to $0.3342 high acted as a support. The current price is slightly positive, but the price is clearly facing a tough resistance near $0.3300 and $0.3340. Therefore, as long as the price is below $0.3340, it remains at a risk of more losses. On the downside, the $0.3020 and $0.3000 levels are decent supports. There is also a bullish trend line formed with support at $0.2935.

Looking at the chart, ripple price might trade in a range above the $0.3000 level before the next move. There are chances of another upward move, but buyers could fail near $0.3300.
Technical indicators
4-hours MACD – The MACD for XRP/USD is slightly placed in the bearish zone.
4-hours RSI (Relative Strength Index) – The RSI for XRP/USD is currently just above the 50 level.
Key Support Level – $0.3020
Key Resistance Level – $0.3220


Leave a Reply
You must be logged in to post a comment.