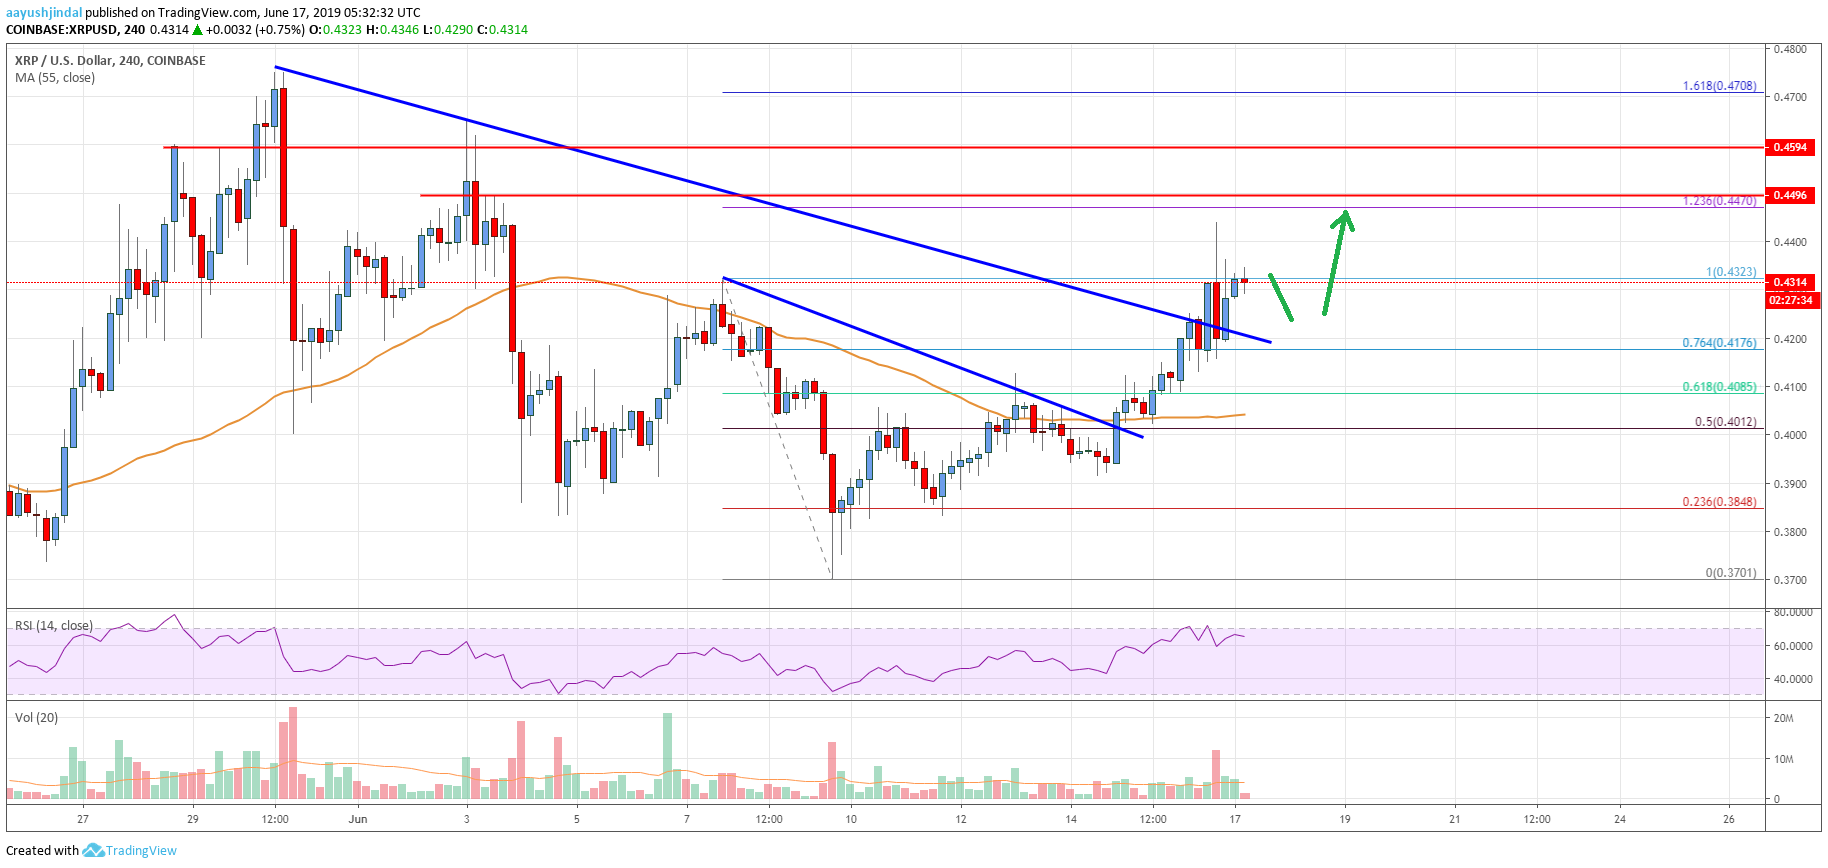
- Ripple price started a strong rise after trading as low as $0.3701 against the US dollar.
- The price traded above a few important resistance levels such as $0.3850, $0.4000 and $0.4200.
- There was a break above two bearish trend lines at $0.4010 and $0.4220 on the 4-hours chart of the XRP/USD pair (data source from Bittrex).
- The price is currently placed in a solid uptrend and it could rise further above $0.4500 and $0.4700.
Ripple price is gaining bullish momentum above $0.4200 against the US Dollar. XRP is likely to extend gains and there are even chances of it hitting the $0.5000 level.
Ripple Price Analysis
This past week, there was a steady rise in bitcoin, Ethereum, bitcoin cash, ADA and ripple against the US Dollar. The XRP/USD pair managed to settle above the $0.3850 and $0.3880 resistance levels. It opened the doors for more gains and the price broke the $0.4000 barrier. There was even a close above the $0.4000 level and the 55 simple moving average (4-hours).
Moreover, there was a break above two bearish trend lines at $0.4010 and $0.4220 on the 4-hours chart of the XRP/USD pair. The pair rallied above the 76.4% Fib retracement level of the last downward move from the $0.4323 high to $0.3701 low. Moreover, there was a break above the last swing high and $0.4400. On the upside, an immediate resistance is near the $0.4470 level.
The 1.236 Fib extension level of the last downward move from the $0.4323 high to $0.3701 low is also near the $0.4470 level. If there are more gains, the price could even break the $0.4500 and $0.4650 levels. The next key barrier is near the $0.4700 level. Moreover, the 1.618 Fib extension level of the last downward move from the $0.4323 high to $0.3701 low is also near $0.4700.
On the downside, there are many supports near the $0.4220 and $0.4200 levels. Besides, the broken trend line near the $0.4200 level may also act as a support. The main support for the bulls is near the $0.4000 level and the 55 SMA.

Looking at the chart, ripple price is currently trading with a positive bias above the $0.4200 support. If there is an upside break above $0.4470, the price is likely to accelerate above $0.4500. The next important barriers for the bulls are near $0.4650 and $0.4700, followed by the key $0.5000 level.
Technical indicators
4 hours MACD – The MACD for XRP/USD is slowly gaining momentum in the bullish zone.
4 hours RSI (Relative Strength Index) – The RSI for XRP/USD is currently above the 60 level, with positive signs.
Key Support Levels – $0.4220, $0.4150 and $0.4000.
Key Resistance Levels – $0.4470 and $0.4700.


Leave a Reply
You must be logged in to post a comment.