
- Ripple price is currently recovering and is trading above the $0.2500 resistance against the US dollar.
- The price is likely to break the $0.2700 and $0.2850 resistance levels in the near term.
- There is a key bullish trend line forming with support near $0.2515 on the 4-hours chart of the XRP/USD pair (data source from Bittrex).
- The price remains well supported on dips near the $0.2600 and $0.2550 levels.
Ripple price is showing positive signs above $0.2600 against the US Dollar. XRP price is likely to accelerate gains towards the $0.3000 level as long as it is above $0.2500.
Ripple Price Analysis
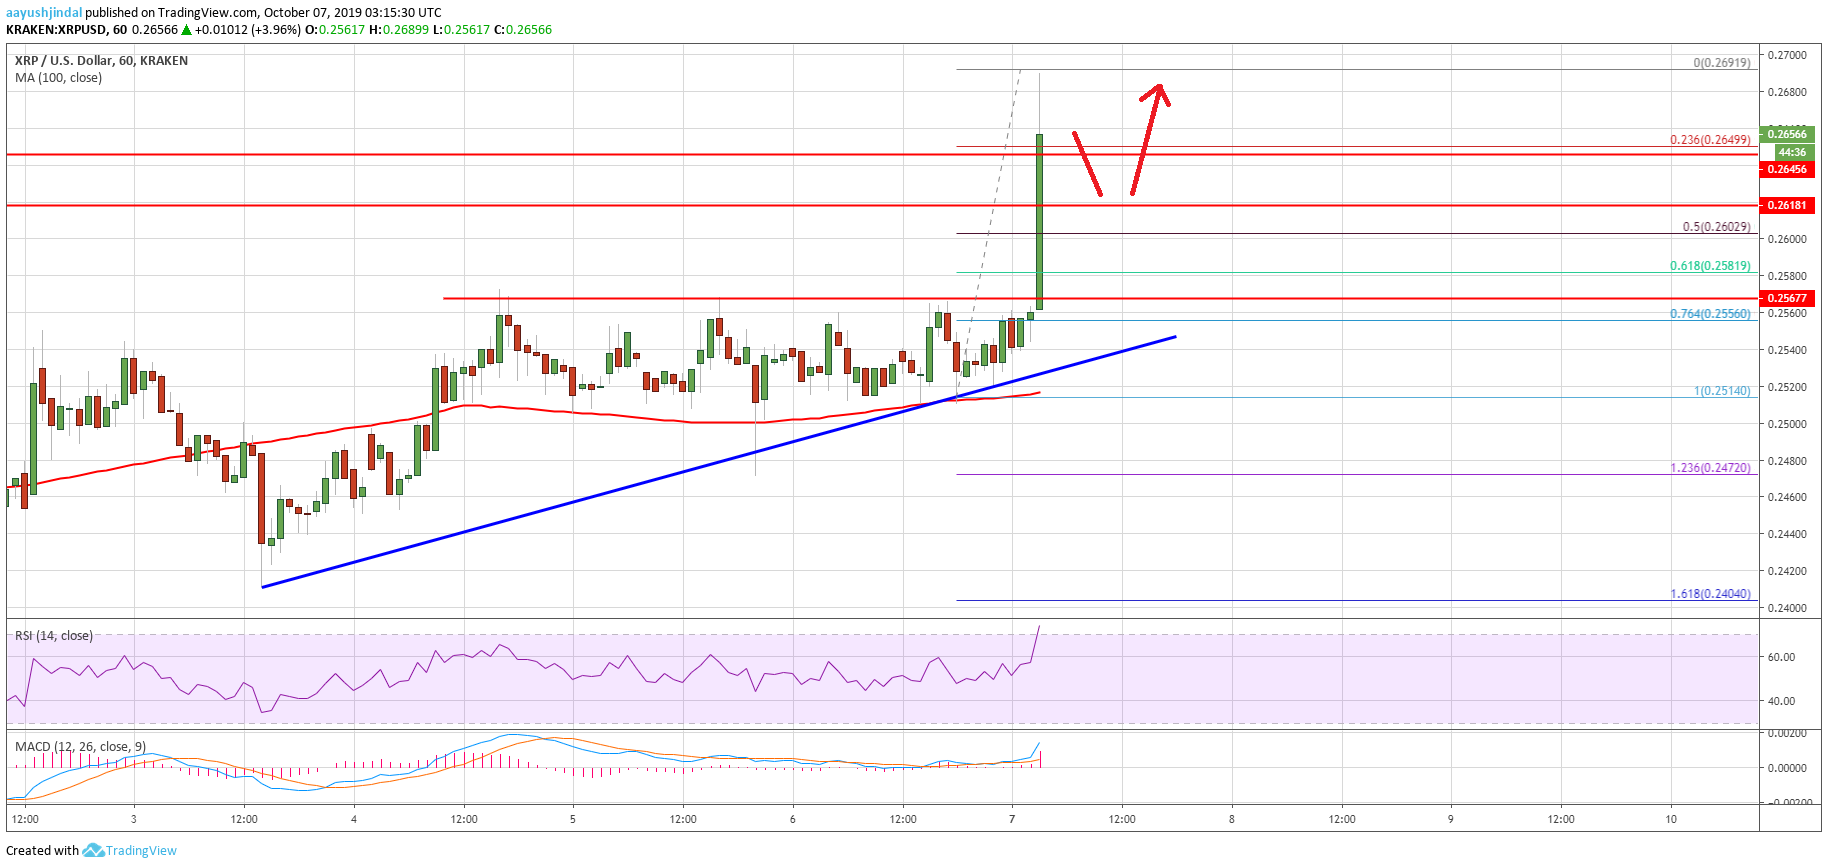
After trading as low as $0.2163, ripple price started an upside correction against the US Dollar. XRP price broke the $0.2250 and $0.2350 resistance levels to start a decent recovery. Moreover, there was a close above the $0.2400 resistance level and the 55 simple moving average (4-hours). On the other hand, bitcoin, Ethereum, bitcoin cash, and BNB struggled to recover and declined recently.
During the recent rise, ripple climbed above the 23.6% Fib retracement level of the last major drop from the $0.3258 high to $0.2163 low. Moreover, there was a break above a connecting bearish trend line with resistance near $0.2560 on the 4-hours chart of the XRP/USD pair. The pair climbed above the $0.2660 resistance and tested the $0.2700 resistance area.
It seems like the 50% Fib retracement level of the last major drop from the $0.3258 high to $0.2163 low is currently acting as a resistance. The price is retreating from highs, but there are many supports on the downside near $0.2660 and $0.2640. Moreover, there is a key bullish trend line forming with support near $0.2515 on the same chart.
Therefore, a downside correction towards the $0.2640 and $0.2600 could find a strong support. On the upside, an immediate resistance is near the $0.2700 and $0.2710 levels. A clear break above the $0.2710 resistance might open the doors for a push towards the $0.2850 resistance. It coincides with the 61.8% Fib retracement level of the last major drop from the $0.3258 high to $0.2163 low.
Looking at the chart, ripple price is showing a lot of positive signs above the $0.2600 and $0.2620 levels. Therefore, there are high chances of more gains above the $0.2710 resistance. If all goes well, the price may even surpass $0.2850 and trade towards the $0.3000 resistance in the coming days.
Technical indicators
4 hours MACD – The MACD for XRP/USD is currently gaining momentum in the bullish zone.
4 hours RSI (Relative Strength Index) – The RSI for XRP/USD is now well above the 50 level.
Key Support Levels – $0.2660, $0.2600 and $0.2550.
Key Resistance Levels – $0.2710 and $0.2850.


Leave a Reply
You must be logged in to post a comment.