
- Ripple price is currently consolidating below the key $0.2500 resistance area against the US dollar.
- The price must settle above $0.2500 and $0.2600 to start a fresh upward move.
- There is a major bearish trend line forming with resistance near $0.2420 on the 4-hours chart of the XRP/USD pair (data source from Bittrex).
- The price could resume its decline if it continues to struggle near $0.2500 and $0.2600.
Ripple price is facing a strong resistance near $0.2500 against the US Dollar. XRP price could either recover nicely above $0.2500 or decline back to $0.2200.
Ripple Price Analysis
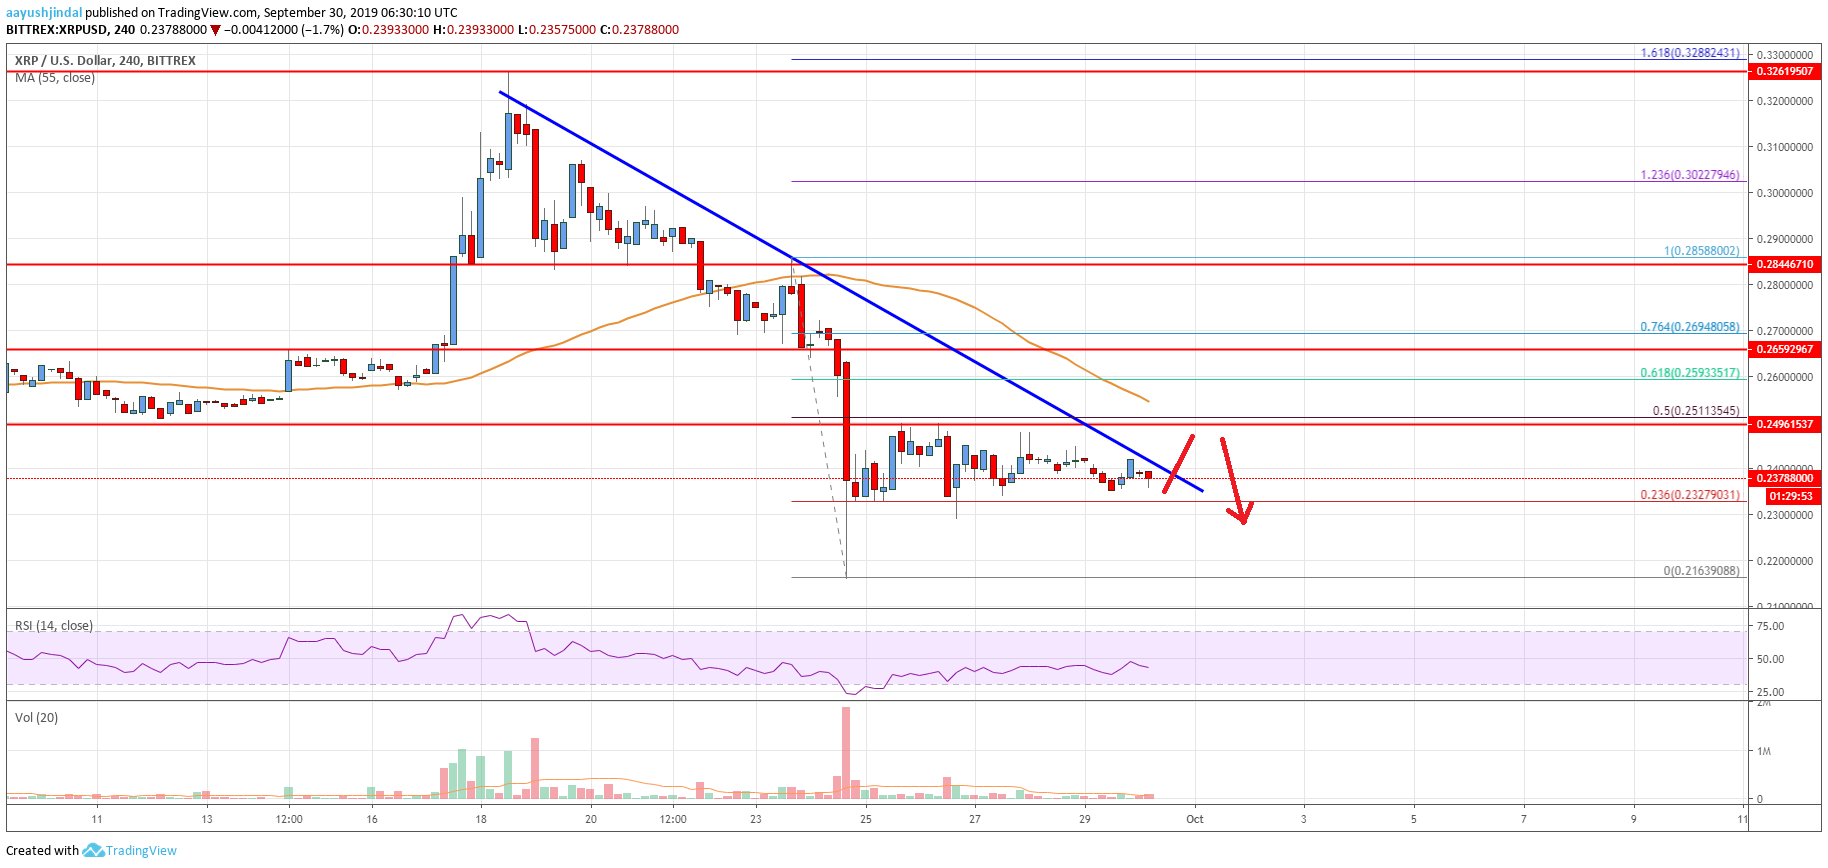
This past week, there was a sharp decline in ripple price below the $0.2600 support against the US Dollar. XRP price even broke the key $0.2500 support area and declined heavily. Moreover, there was a close below the $0.2500 level and the 55 simple moving average (4-hours). It opened the doors for more losses and the price traded to a new monthly low at $0.2163.
Recently, it started an upside correction above $0.2200 and $0.2350. Moreover, it broke the 23.6% Fib retracement level of the last major decline from the $0.2858 high to $0.2163 low. However, the price faced a strong resistance near $0.2500 and stayed well below the 55 simple moving average (4-hours). Moreover, the 50% Fib retracement level of the last major decline from the $0.2858 high to $0.2163 low is near $0.2510 to provide resistance.
There is also a major bearish trend line forming with resistance near $0.2420 on the 4-hours chart of the XRP/USD pair. Therefore, a clear break above the trend line and the $0.2500 resistance is needed for a solid recovery. The next immediate resistance is near $0.2600 and $0.2650, above which the price will most likely revisit the $0.3000 resistance area.
Conversely, if the price fails to break the $0.2500 resistance or $0.2600, it could resume its decline. An immediate support is near the $0.2320 level. If there is a downside break below $0.2320, the price is likely to retest the $0.2160 zone. Any further losses may perhaps push the price towards the main $0.2000 support in the near term.
Looking at the chart, ripple price is facing a strong resistance near the $0.2480 and $0.2500 level. It won’t be easy for the bulls to gain strength above $0.2500. If they continue to struggle, there could be another drop towards $0.2150 and $0.2050.
Technical indicators
4 hours MACD – The MACD for XRP/USD is currently losing momentum in the bearish zone.
4 hours RSI (Relative Strength Index) – The RSI for XRP/USD is still below the 50 level, with a bearish angle.
Key Support Levels – $0.2320, $0.2150 and $0.2050.
Key Resistance Levels – $0.2500 and $0.2650.


Leave a Reply
You must be logged in to post a comment.