- Ripple price climbed higher sharply after it broke the $0.2650 resistance against the US dollar.
- The price is currently correcting lower after it posted a new monthly high near $0.3260.
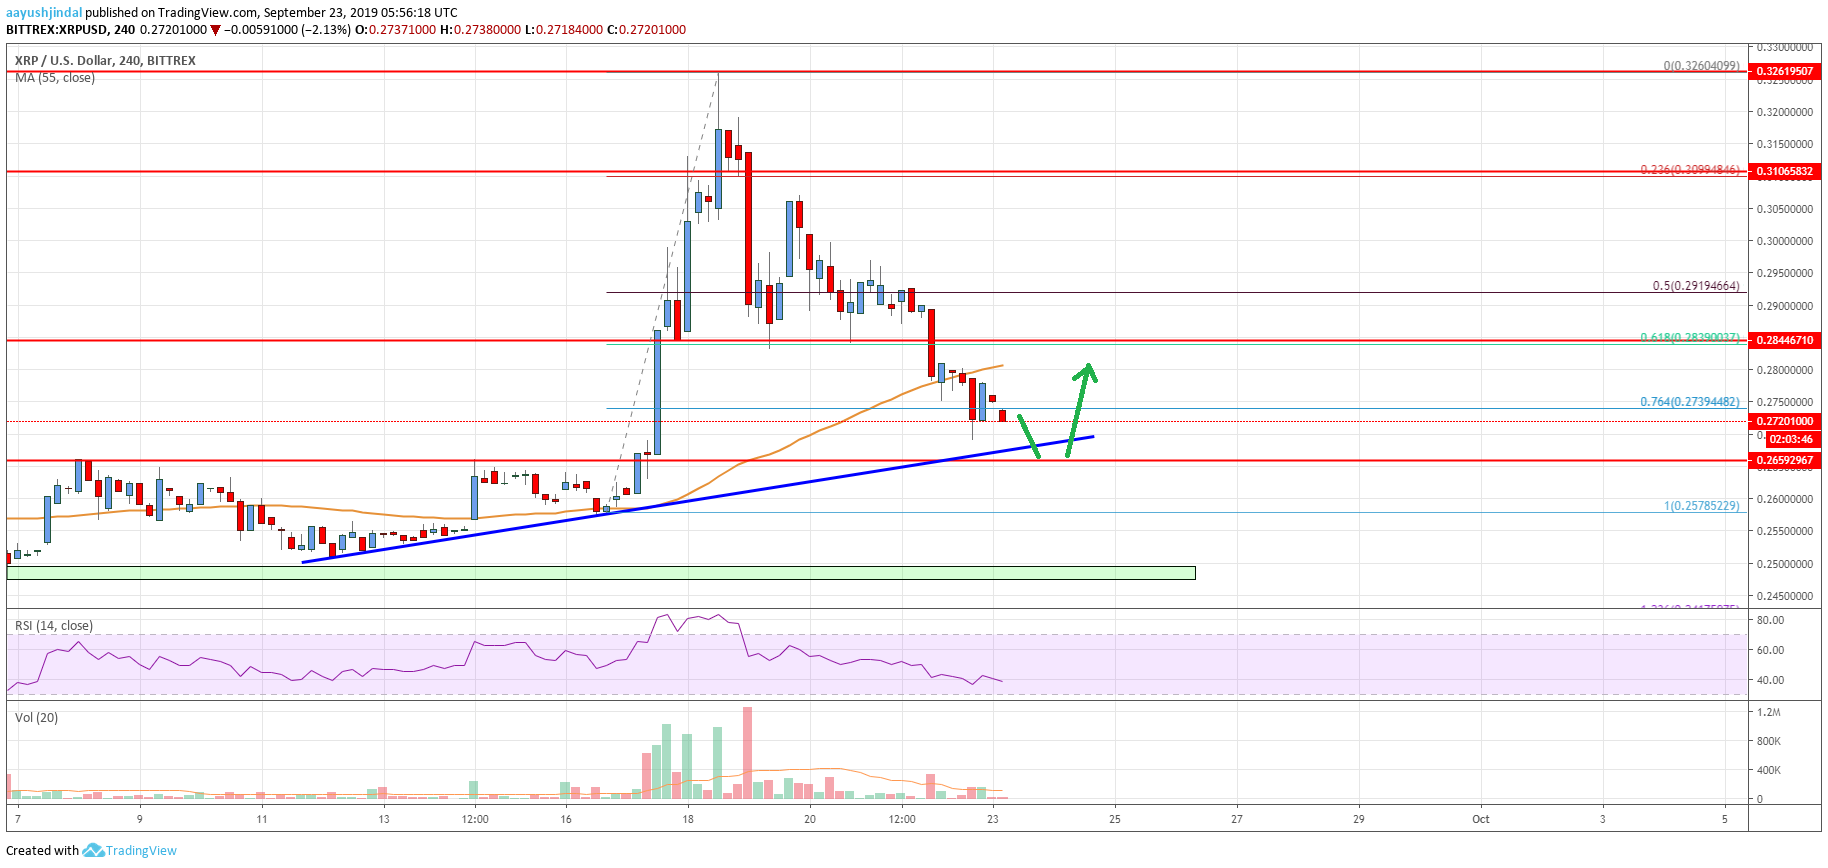
- There is a major bullish trend line forming with support near $0.2680 on the 4-hours chart of the XRP/USD pair (data source from Bittrex).
- The price remains well supported on the downside near the $0.2680 and $0.2650 levels.
Ripple price is currently under pressure below $0.3000 against the US Dollar. However, XRP price is likely to bounce back as long as it is above the $0.2650 support.
Ripple Price Analysis
This past week, we discussed the chances of an upside break in ripple price if it breaks $0.2650 resistance against the US Dollar. XRP price did break the $0.2650 resistance and surged above $0.3000. Similarly, there were gains in Ethereum, bitcoin cash, ADA and XLM against the US Dollar, but bitcoin struggled to climb higher. The XRP/USD pair even broke the $0.3120 resistance and the 55 simple moving average (4-hours).
Finally, it traded to a new monthly high near $0.3260 and it is currently correcting lower. It declined heavily below $0.3120 and trimmed most it’s this past week’s gains. Moreover, there was a break below the 50% Fib retracement level of the last major upward move from the $0.2578 low to $0.3260 high. The price even broke the $0.2800 support and the 55 simple moving average (4-hours).
It is now trading below the 76.4% Fib retracement level of the last major upward move from the $0.2578 low to $0.3260 high. On the downside, there is a crucial support area near the $0.2650 level. Moreover, there is a major bullish trend line forming with support near $0.2680 on the 4-hours chart of the XRP/USD pair. If there is a downside break below the $0.2650 support, ripple price could revisit the $0.2450 support area.
Conversely, if there is an upside break above $0.2800 and the 55 simple moving average (4-hours), the price could start a fresh increase. Having said that, the price must stay above the $0.2650 support area to bounce back in the coming sessions.

Looking at the chart, ripple price is trimming gains from the $0.3260 swing high. It is now approaching a solid support area near $0.2650. Therefore, it could either bounce back from $0.2650 or it might collapse towards $0.2450 and $0.2200.
Technical indicators
4 hours MACD – The MACD for XRP/USD is currently gaining momentum in the bearish zone.
4 hours RSI (Relative Strength Index) – The RSI for XRP/USD is now well below the 50 level, with a bearish angle.
Key Support Levels – $0.2680, $0.2650 and $0.2500.
Key Resistance Levels – $0.2800 and $0.2950.


Leave a Reply
You must be logged in to post a comment.