- Bitcoin price is trading in a minor downtrend below the $10,500 resistance against the US Dollar.
- The price is holding a couple of important supports near the $10,150 and $9,880 levels.
- There is a crucial breakout pattern forming with resistance near $10,320 on the 4-hours chart of the BTC/USD pair (data feed from Coinbase).
- The pair could either rally sharply above $10,350 or it could extend its decline to $9,880 and $9,750.
Bitcoin price is trading in a contracting range above $10,000 against the US Dollar. BTC is likely setting up for the next crucial break in the near term.
Bitcoin Price Analysis
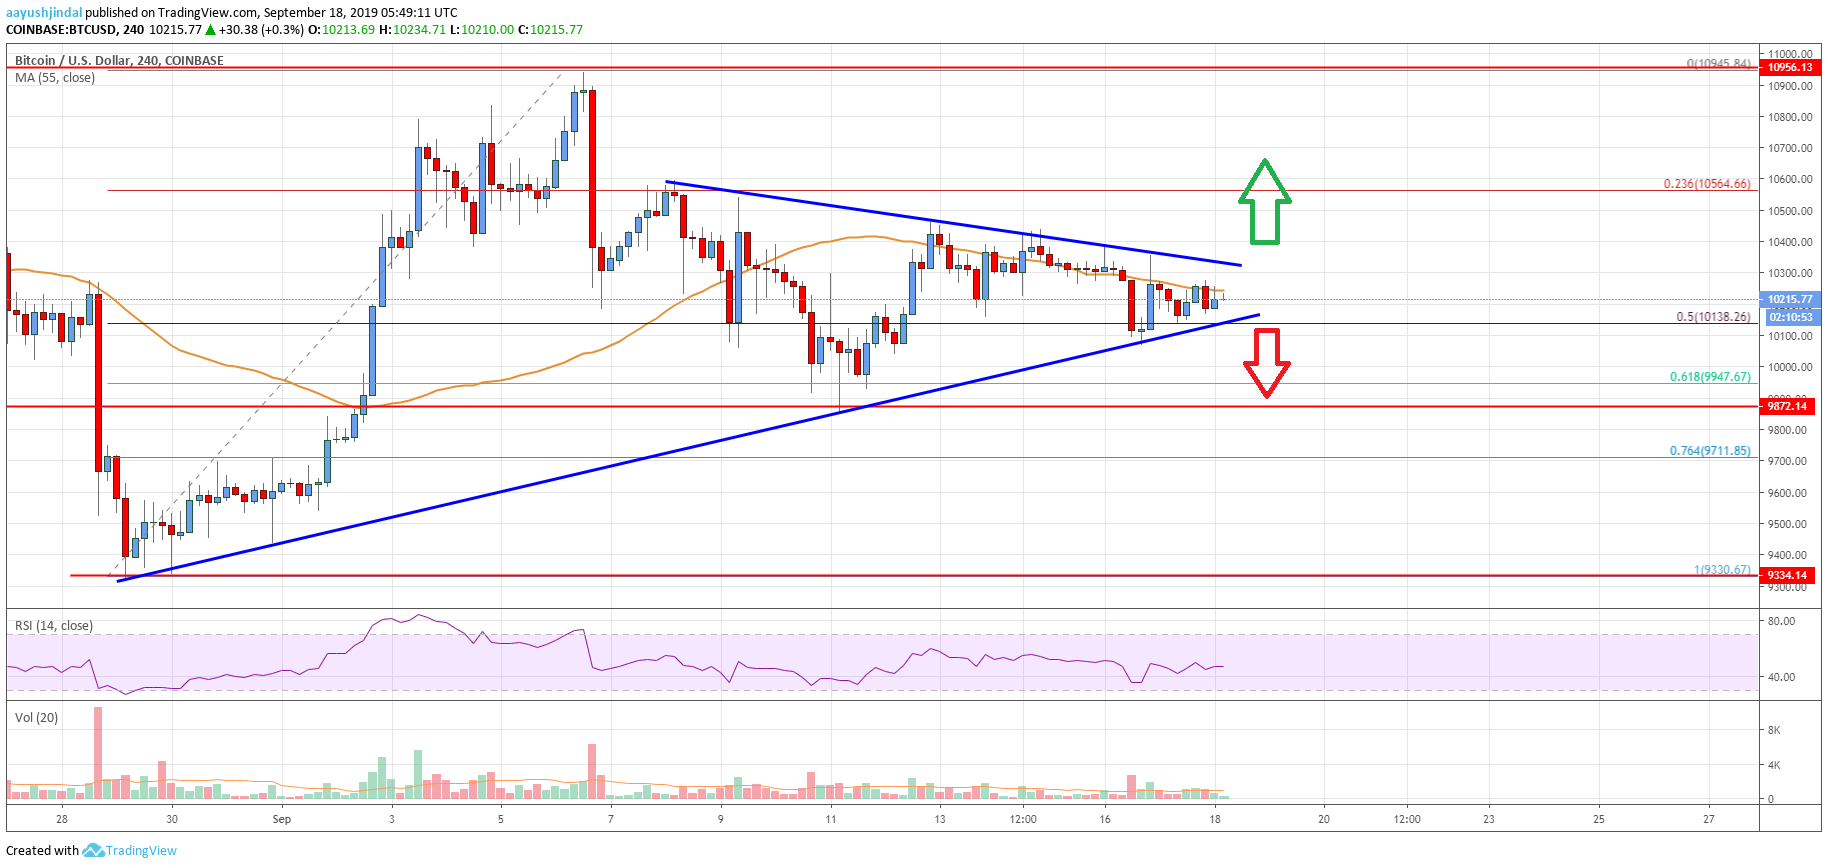
Recently, bitcoin price failed to climb above the $10,500 resistance against the US Dollar. As a result, the BTC/USD pair started a slow and steady decline below the $10,400 support. Moreover, there was a break below the $10,350 level and the 55 simple moving average (4-hours). It opened the doors for more downsides below $10,200. Earlier, the price spiked below the 50% Fib retracement level of the last key leg from the $9,331 low to $10,950 swing high.
However, the price remained well bid near the $9,900 and $9,880 levels. Additionally, the 61.8% Fib retracement level of the last key leg from the $9,331 low to $10,950 swing high also acted as a support. At the moment, the price is trading in a contracting range near the $10,200 level. More importantly, there is a crucial breakout pattern forming with resistance near $10,320 on the 4-hours chart of the BTC/USD pair.
If bitcoin price breaks the $10,320 resistance area, there could be a decent upward move. The next key resistance is near the $10,500 level. Any further upsides could push the price towards the $11,000 resistance zone. On the downside, the breakdown support is near the $10,150 level. If there is a close below $10,150, the price could accelerate its decline.
The next major support is near $9,880, below which there are chances of a drop towards the $9,550 level. An intermediate support is near the $9,710 level. It represents the 76.4% Fib retracement level of the last key leg from the $9,331 low to $10,950 swing high.

Looking at the chart, bitcoin price is clearly setting up for the next crucial break either above $10,320 or below $10,150. The current price action is choppy, but there are very less chances of a strong upward move above $10,400 in the short term.
Technical indicators
4 hour MACD – The MACD is slowly losing momentum in the bearish zone.
4 hour RSI (Relative Strength Index) – The RSI is currently well below the 50 level.
Key Support Levels – $10,150 and $9,880.
Key Resistance Levels – $10,320, $10,400 and $10,500.


Leave a Reply
You must be logged in to post a comment.