
- Stellar lumen price rallied this past week above the $0.0800 resistance area against the US Dollar.
- XLM price even broke the $0.0900 level and recently started a nasty decline below $0.0800.
- There is a declining channel forming with resistance near $0.0680 on the 4-hours chart (data feed via Kraken).
- The pair remains at a risk of more losses and it could even revisit the $0.0570 support area.
Stellar lumen price is back in a bearish zone after a massive rally against the US Dollar. XLM price might even struggle to bounce back from the $0.0600 support area.
Stellar Lumen Price Analysis (XLM to USD)
This past week, there was a sharp rise in stellar lumen price above the $0.0600 resistance against the US Dollar. The XLM/USD pair surged more than 25% and broke many resistances near $0.0700 and $0.0800. Moreover, there was a break above the $0.0850 level and the 55 simple moving average (4-hours). Finally, the price traded to a new monthly high at $0.0962 and recently started a fresh decline.
The bears took control and pushed the price below the $0.0800 level. Moreover, there was a break below the 50% Fibonacci retracement level of the last major wave from the $0.0573 low to $0.0962 high. It opened the doors for more downsides below the $0.0700 level and the 55 simple moving average (4-hours). The price is now trading below the $0.0680 level, plus the 76.4% Fibonacci retracement level of the last major wave from the $0.0573 low to $0.0962 high.
If there are more downsides, the price could test the main $0.0600 support area. If the bears remain in action, there are chances of stellar price dropping to $0.0570. Any further losses might call for a push towards the $0.0550 support area.
Conversely, if the price holds the $0.0600 support area, it could bounce back. It seems like there is a declining channel forming with resistance near $0.0680 on the 4-hours chart. If there is a successful close above the $0.0680 and $0.0700 resistance levels, the price could start a fresh increase towards $0.0800 and $0.0820.
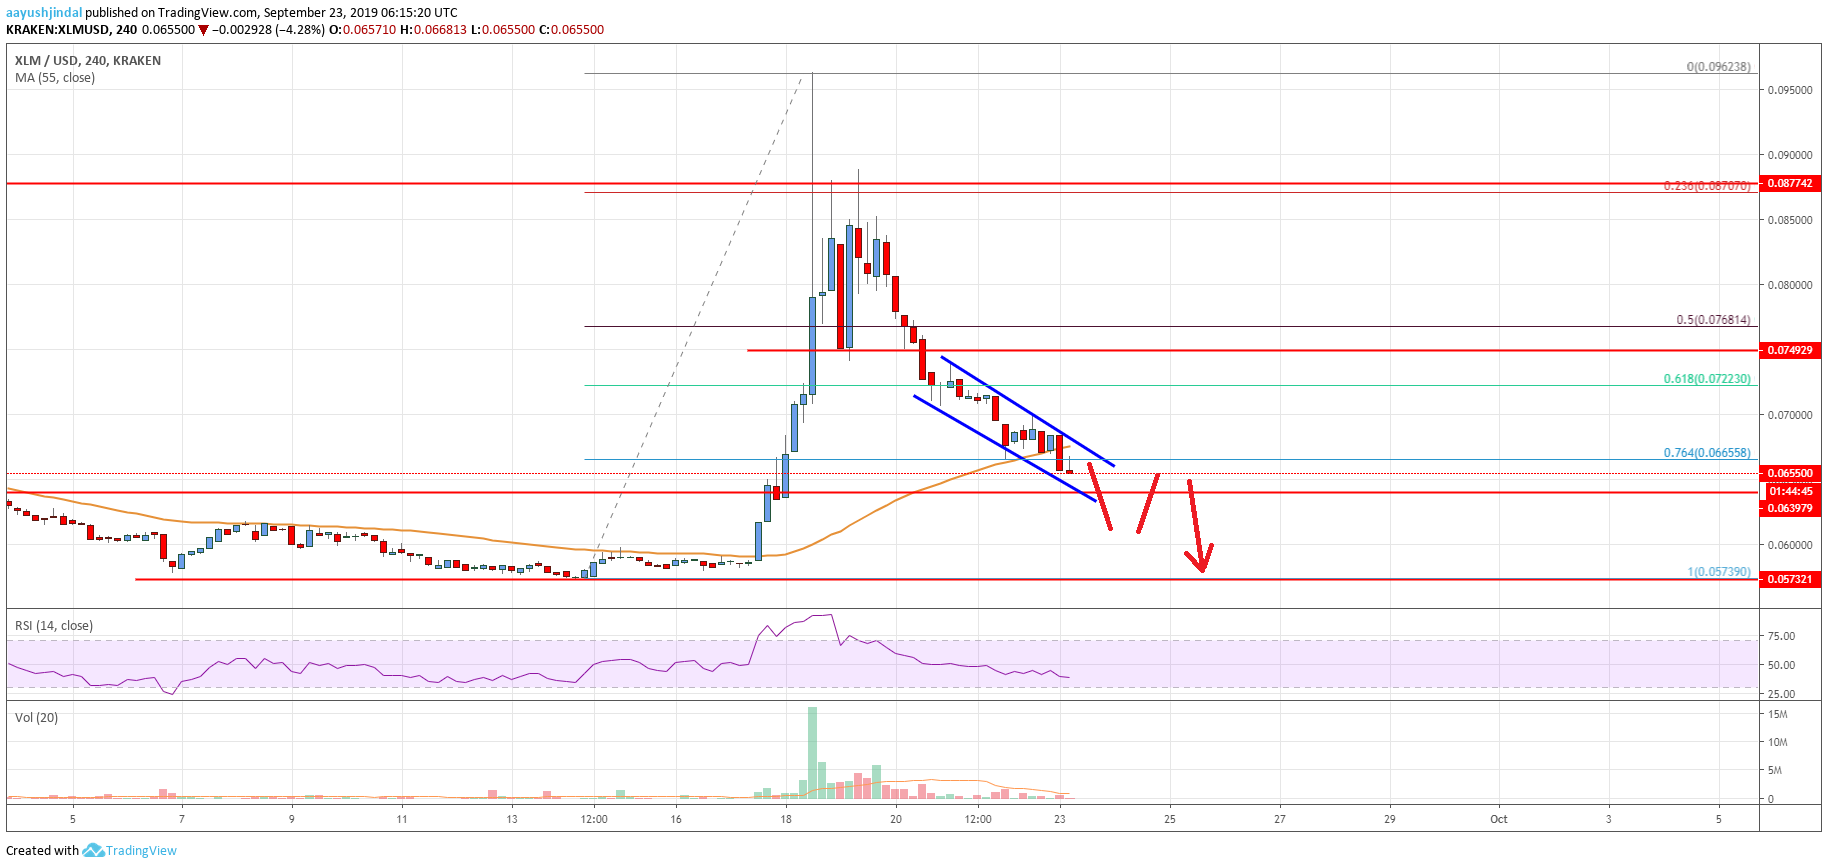
The chart indicates that XLM price is clearly back in a bearish zone below $0.0700. Therefore, there is a risk of more downsides below $0.0650 and $0.0620 in the near term. Only a close above the $0.0700 level might push the price back into a positive zone. The next key resistances are near $0.0750 and $0.0765.
Technical Indicators
4 hours MACD – The MACD for XLM/USD is currently gaining pace in the bearish zone.
4 hours RSI – The RSI for XLM/USD is currently well below the 50 level.
Key Support Levels – $0.0650 and $0.0600.
Key Resistance Levels – $0.0680, $0.0700 and $0.0750.


Leave a Reply
You must be logged in to post a comment.