- Stellar lumen price declined steadily after it broke the $0.0625 support against the US Dollar.
- XLM price tested the $0.0575 zone and it is currently correcting higher.
- There is a major bearish trend line forming with resistance near $0.0590 on the 4-hours chart (data feed via Kraken).
- The pair could start a decent recovery if it breaks the $0.0590 and $0.0600 resistance levels.
Stellar lumen price is in a bearish zone below $0.0600 against the US Dollar. XLM price might correct higher in the short term if it settles above $0.0600.
Stellar Lumen Price Analysis (XLM to USD)
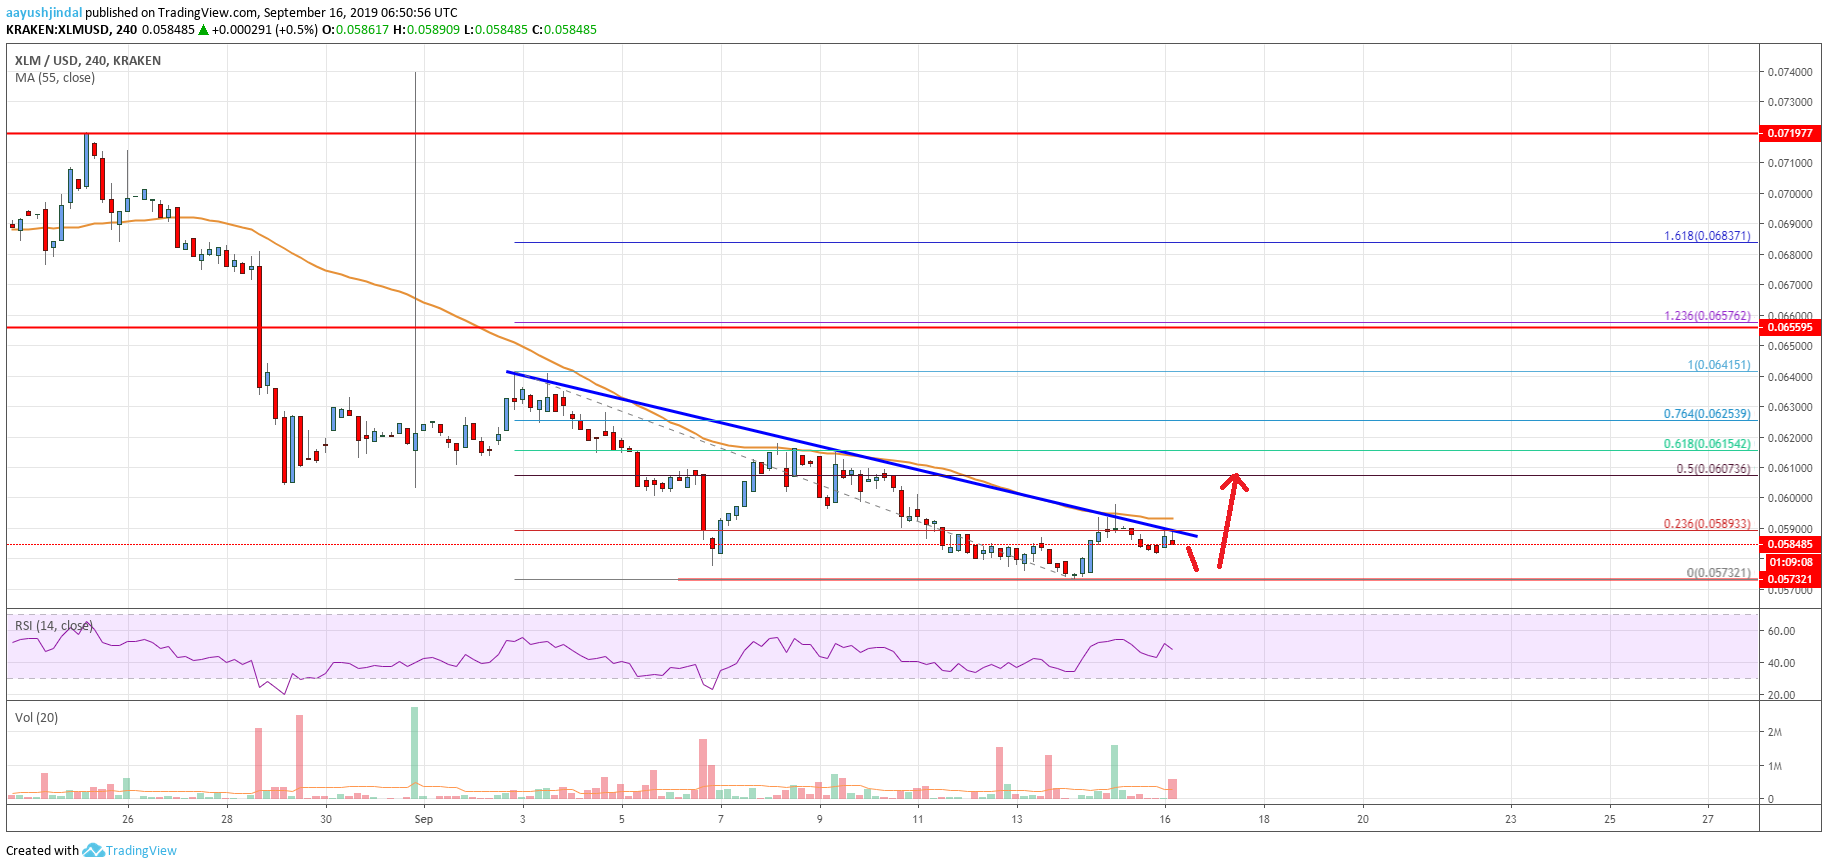
In the last analysis, we discussed a possible breakdown in stellar lumen price below the $0.0600 support against the US Dollar. The XLM/USD pair failed to climb above the $0.0630 or $0.0655 resistance levels. As a result, there was a breakdown below the $0.0600 support area. Moreover, the price settled below the $0.0600 level and the 55 simple moving average (4-hours). It opened the doors for more downsides and a new monthly low was formed near $0.0572.
At the outset, the price is correcting higher above $0.0580. It tested the 23.6% Fibonacci retracement level of the last drop from the $0.0641 high to $0.0572 low. However, the upward move was capped by the $0.0600 resistance and the 55 simple moving average (4-hours). Moreover, there is a major bearish trend line forming with resistance near $0.0590 on the 4-hours chart.
If there is an upside break above the $0.0600 resistance area, there could be a short term recovery. An immediate resistance is near $0.0607. It coincides with the 50% Fibonacci retracement level of the last drop from the $0.0641 high to $0.0572 low. If there are more upsides, the price could continue to rise towards the $0.0615 and $0.0625 resistance levels.
Conversely, if the price fails to break the $0.0600 resistance, it could resume its decline. An immediate support is near the $0.0575 level, below which the price is likely to slide towards the $0.0550 level. Any further downside might start a solid decline towards the $0.0500 support area.
The chart indicates that XLM price is trading in a bearish zone below the $0.0600 level and the 55 SMA. If there is an upside break above the $0.0600 level plus a close above the 55 SMA, the price could start a decent recovery towards the $0.0625 and $0.0640 levels. If not, it could decline towards $0.0550 or even $0.0500.
Technical Indicators
4 hours MACD – The MACD for XLM/USD is struggling to gain in the bullish zone.
4 hours RSI – The RSI for XLM/USD is currently just below the 50 level.
Key Support Levels – $0.0575 and $0.0550.
Key Resistance Levels – $0.0590, $0.0600 and $0.0625.