
- Stellar lumen price traded to a new monthly low at $0.0525 against the US Dollar.
- XLM price is currently correcting higher, but it is facing a strong resistance near $0.0620.
- There was a break above a connecting bearish trend line at $0.0592 on the 4-hours chart (data feed via Kraken).
- The pair is currently consolidating and it might struggle to climb above $0.0620 and $0.0650.
Stellar lumen price is trading in a bearish zone below $0.0650 against the US Dollar. XLM price remains at a risk of more losses below the $0.0550 support.
Stellar Lumen Price Analysis (XLM to USD)
This past week, there was a major decline in stellar lumen price below the $0.0650 support against the US Dollar. The XLM/USD pair broke many key supports near $0.0620 and $0.0600 to enter a bearish zone. Moreover, there was a close below the $0.0620 level and 55 simple moving average (4-hours). Finally, the price traded to a new monthly low at $0.0525 before starting an upside correction.
There was a break above the $0.0550 level to start the correction. Moreover, there was a break above a connecting bearish trend line at $0.0592 on the 4-hours chart. However, the upward move was capped by the $0.0620 resistance area. Additionally, the 23.6% Fibonacci retracement level of the last major decline from the $0.0888 high to $0.0525 low also prevented gains.
The price is now trading well below the $0.0620 level and the 55 simple moving average (4-hours). To start a solid recovery, the price must move above $0.0620 and $0.0650. The next key resistance is near the $0.0700 level. Besides, the 50% Fibonacci retracement level of the last major decline from the $0.0888 high to $0.0525 low is near the $0.0707 level.
Conversely, if the price fails to break the $0.0620 resistance, it could continue to move down. An immediate support is near the $0.0550 level. If there is a downside break below $0.0550, the price could retest the $0.0525 low. Any further declines might call for a push towards the $0.0500 support area.
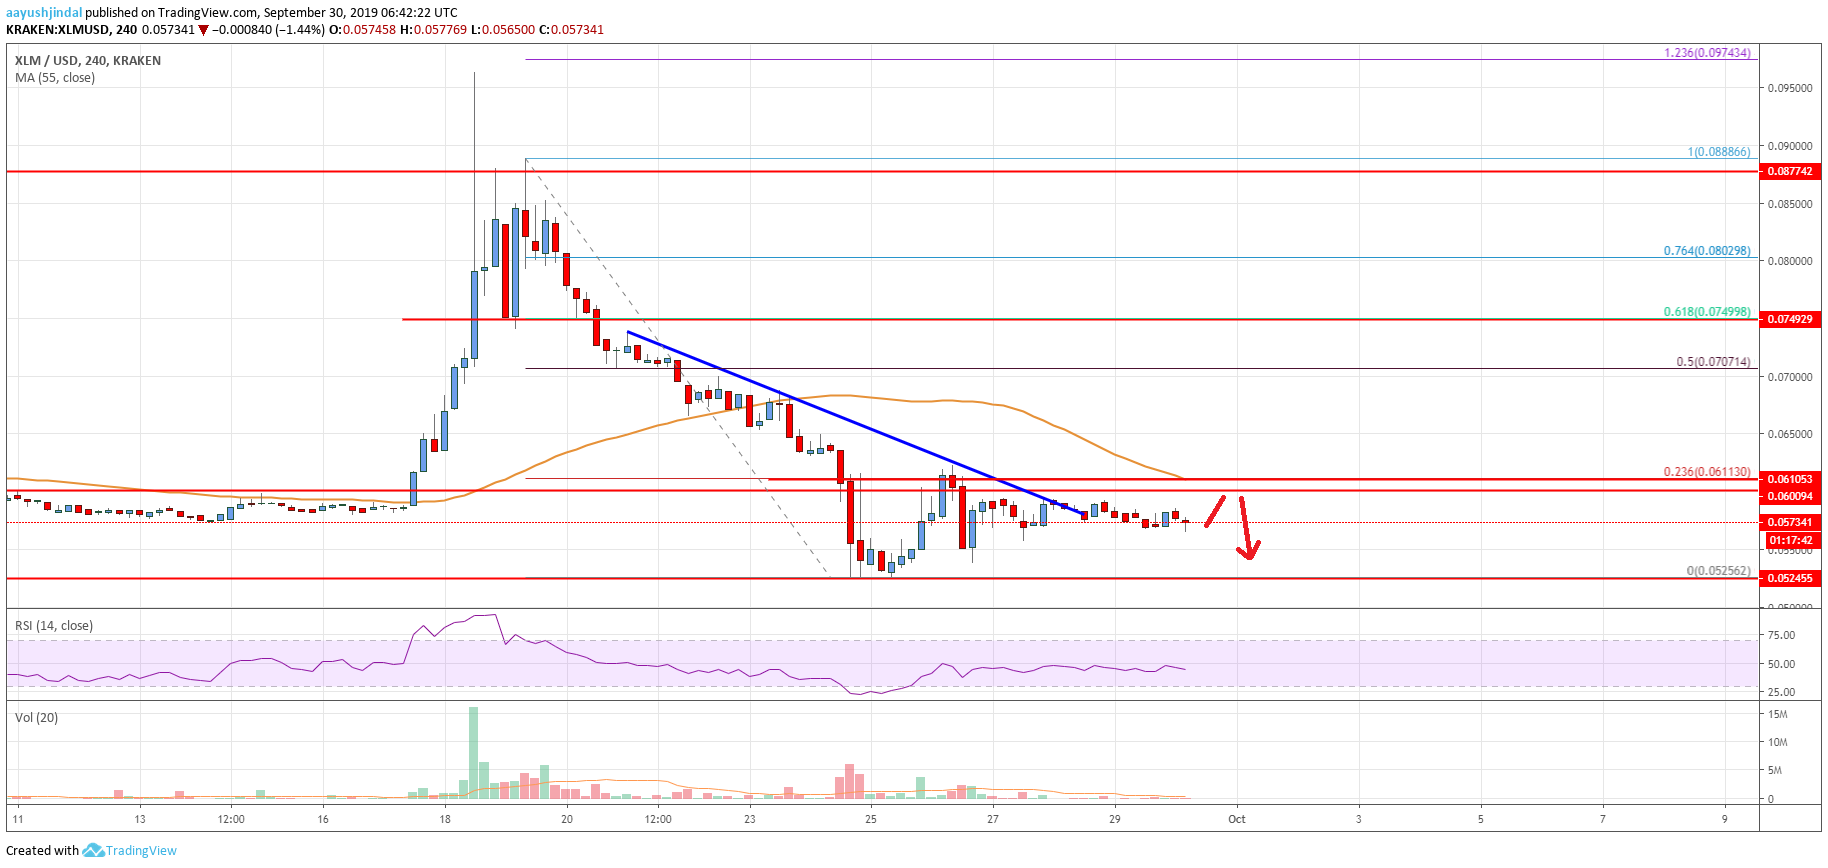
The chart indicates that XLM price is clearly trading below a strong resistance area near the $0.0620 level and the 55 SMA. If there is a successful close above the 55 SMA, there are chances of a solid recovery to $0.0700. If not, the price might retest the $0.0525 low or it could even test the $0.0500 support.
Technical Indicators
4 hours MACD – The MACD for XLM/USD is currently losing pace in the bullish zone.
4 hours RSI – The RSI for XLM/USD is struggling to move above the 50 level.
Key Support Levels – $0.0620 and $0.0650.
Key Resistance Levels – $0.0550, $0.0525 and $0.0500.


Leave a Reply
You must be logged in to post a comment.