- Ripple price declined recently after it failed to clear the $0.4920 resistance area against the US dollar.
- The price broke the key $0.4400 support area and it even spiked below the $0.4000 level.
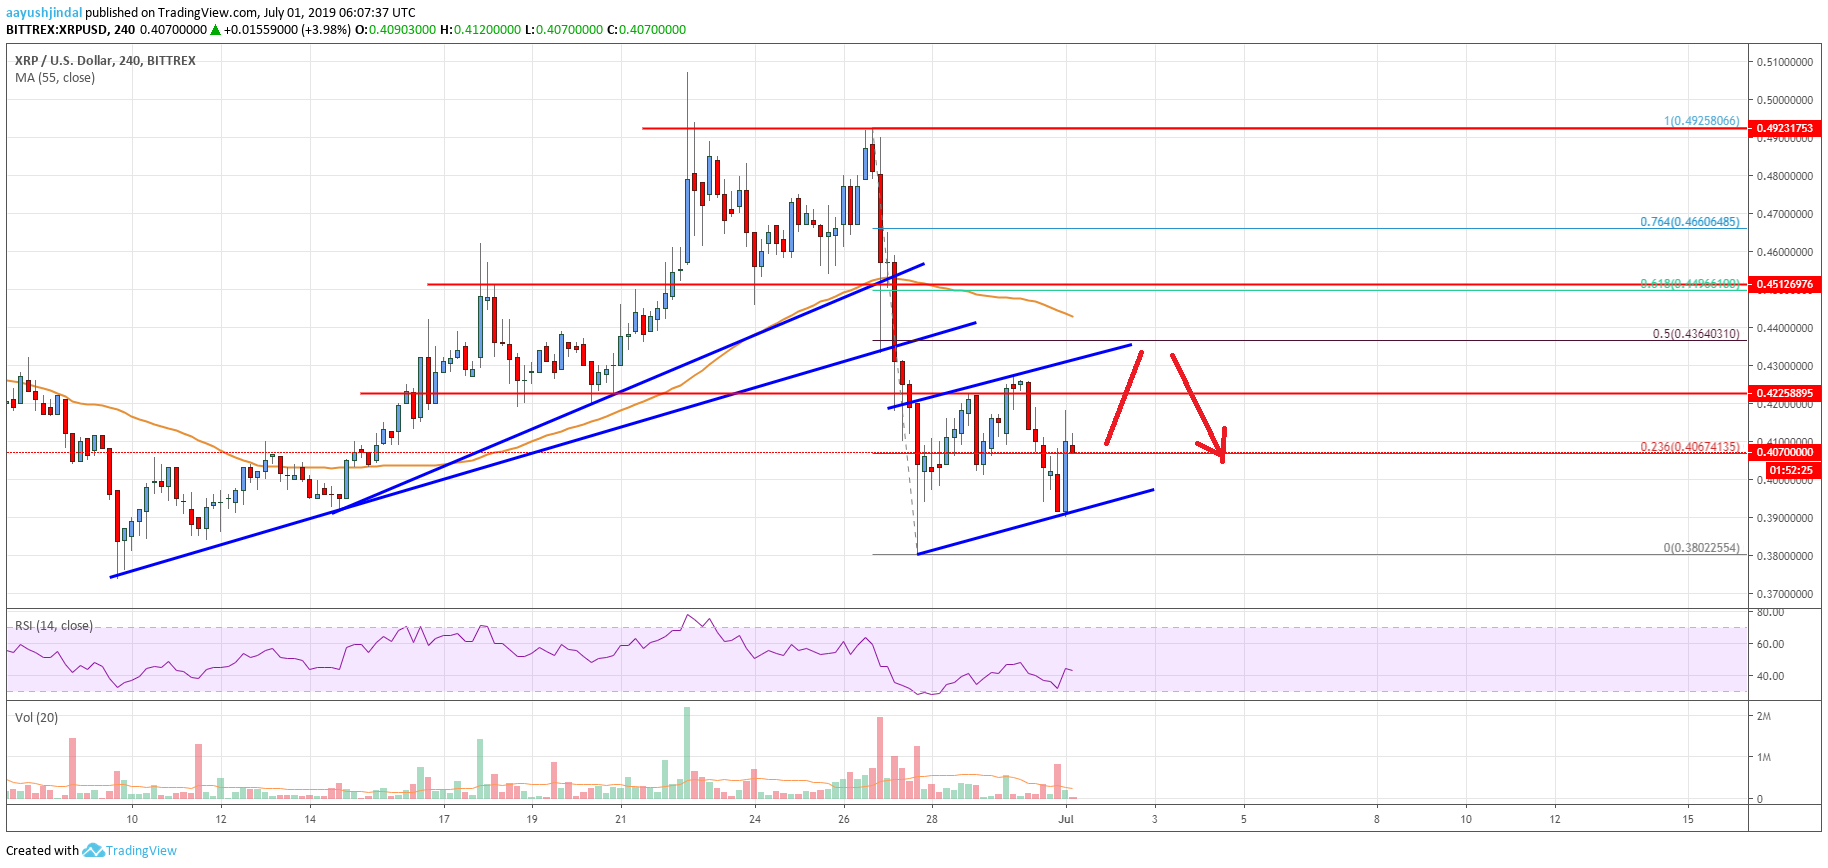
- There was a break below two bullish trend line with support near $0.4510 and $0.4400 on the 4-hours chart of the XRP/USD pair (data source from Bittrex).
- The price is currently correcting higher, but it could face a lot of hurdles near $0.4360.
Ripple price declined below $0.4400 and moved into a bearish zone against the US Dollar. XRP is moving higher, but it might struggle to climb above the $0.4200 and $0.4360 levels.
Ripple Price Analysis
This past week, there was a major drop in bitcoin, Ethereum, bitcoin cash, ADA and ripple against the US Dollar. The XRP/USD pair failed to clear the $0.4920, $0.4950 and $0.5000 resistance levels. As a result, there was a major decline below the $0.4600 and $0.4500 support levels. Moreover, there was a close below the $0.4500 support and the 55 simple moving average (4-hours).
More importantly, there was a break below two bullish trend line with support near $0.4510 and $0.4400 on the 4-hours chart of the XRP/USD pair. Finally, there was a break below the $0.4200 support and the $0.4000 pivot level. A swing low was formed near $0.3802 before the price started an upside correction. There was a break above the $0.3920 and $0.4000 levels.
Moreover, the price climbed above the 23.6% Fib retracement level of the last decline from the $0.4925 high to $0.3802 low. However, the upward move was capped by the $0.4250 zone. The main resistances on the upsides are near $0.4250 and $0.4360. The 50% Fib retracement level of the last decline from the $0.4925 high to $0.3802 low is also near the $0.4364 level.
At the moment, the price seems to be following an ascending channel with support near $0.4020 on the same chart. If there is an upside break above the $0.4360 resistance, the price could continue to rise in the near term. On the other hand, if there is a downside break, the price could extend losses below the $0.4000 support area. In the mentioned case, the price may even test the $0.3800 level.

Looking at the chart, ripple price is currently correcting higher above $0.4000. However, there are many hurdles on the upside near the $0.4250 and $0.4360.
Technical indicators
4 hours MACD – The MACD for XRP/USD is slowly gaining momentum in the bullish zone.
4 hours RSI (Relative Strength Index) – The RSI for XRP/USD is currently just above the 40 level, with positive signs.
Key Support Levels – $0.4020, $0.4000 and $0.3800.
Key Resistance Levels – $0.4250 and $0.4360.


Leave a Reply
You must be logged in to post a comment.