- Stellar lumen price declined heavily after it failed to climb above $0.1320 against the US Dollar.
- XLM price broke many supports and even settled below the $0.1175 pivot level.
- Recently, there was a break below an ascending channel with support at $0.1100 on the 4-hours chart (data feed via Kraken).
- The pair is currently struggling to recover and it could break the $0.1040 support area.
Stellar lumen price is facing many hurdles on the upside near $0.1110 against the US Dollar. XLM price must stay above the $0.1040 support to avoid additional losses.
Stellar Lumen Price Analysis (XLM to USD)
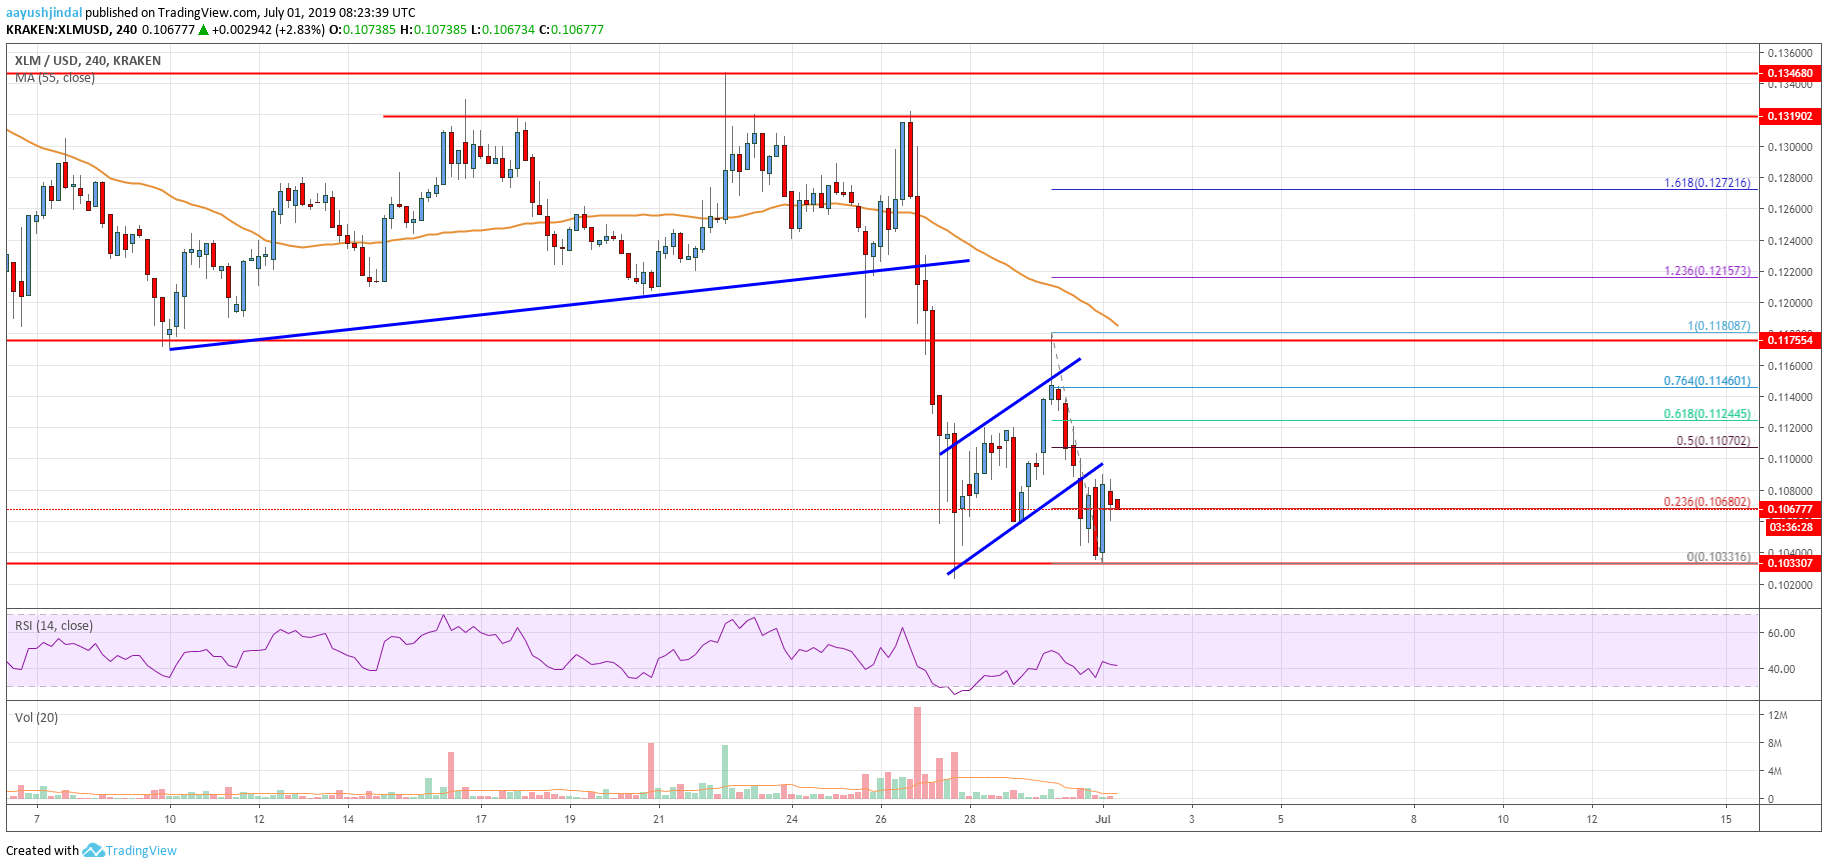
This past week, stellar lumen price made a few attempts to break the $0.1320 resistance against the US Dollar. The XLM/USD pair failed to gain momentum, resulting in a fresh decline below the $0.1250 support area. There was a clear break below the $0.1200 support and the 55 simple moving average (4-hours). Moreover, there was a break below a major bullish trend line with support near $0.1240 on the 4-hours chart.
The price even broke the $0.1100 support and traded as low as $0.1033. Recently, there was an upside correction above the $0.1100 level. However, the price failed to surpass the previous support near $0.1175. Finally, the price declined again below the $0.1100 support area. Moreover, there was a break below an ascending channel with support at $0.1100 on the 4-hours chart.
Stellar price retested the $0.1040 support and it is currently consolidating losses. It is trading above $0.1070 and the 23.6% Fibonacci retracement level of the upward move from the $0.1204 low to $0.1345 high. However, there are many hurdles on the upside for buyers near $0.1110 and $0.1120. An immediate resistance is near the $0.1108 level. The 50% Fibonacci retracement level of the upward move from the $0.1204 low to $0.1345 high is also near the $0.1108 level to act as a resistance.
Having said that, a close above the $0.1150 and $0.1175 levels is needed for more gains. If there is an upside break, the price could revisit the $0.1320 resistance level. If not, there is a risk of more losses below the $0.1060 and $0.1040 support levels.

The chart indicates that XLM price is trading above a major support near $0.1040. If there are more losses, the price could even struggle to hold the main $0.1000 support area.
Technical Indicators
4 hours MACD – The MACD for XLM/USD is slowly away from the bearish zone, with a positive bias.
4 hours RSI – The RSI for XLM/USD is currently just above the 40 level, with a positive angle.
Key Support Levels – $0.1040 and $0.1000.
Key Resistance Levels – $0.1125, $0.1150 and $0.1175.


Leave a Reply
You must be logged in to post a comment.