- Stellar lumen price is facing a few key hurdles near $0.1320 and $0.1345 against the US Dollar.
- XLM price is holding the $0.1250 support and it could continue to rise in the near term.
- There is a short term breakout pattern forming with resistance at $0.1280 on the 4-hours chart (data feed via Kraken).
- The pair is currently moving higher and it looks set for an upside break above $0.1300.
Stellar lumen price is gaining traction and it could climb above $0.1350 against the US Dollar. XLM price must stay above the $0.1200 level to remains in a positive zone.
Stellar Lumen Price Analysis (XLM to USD)
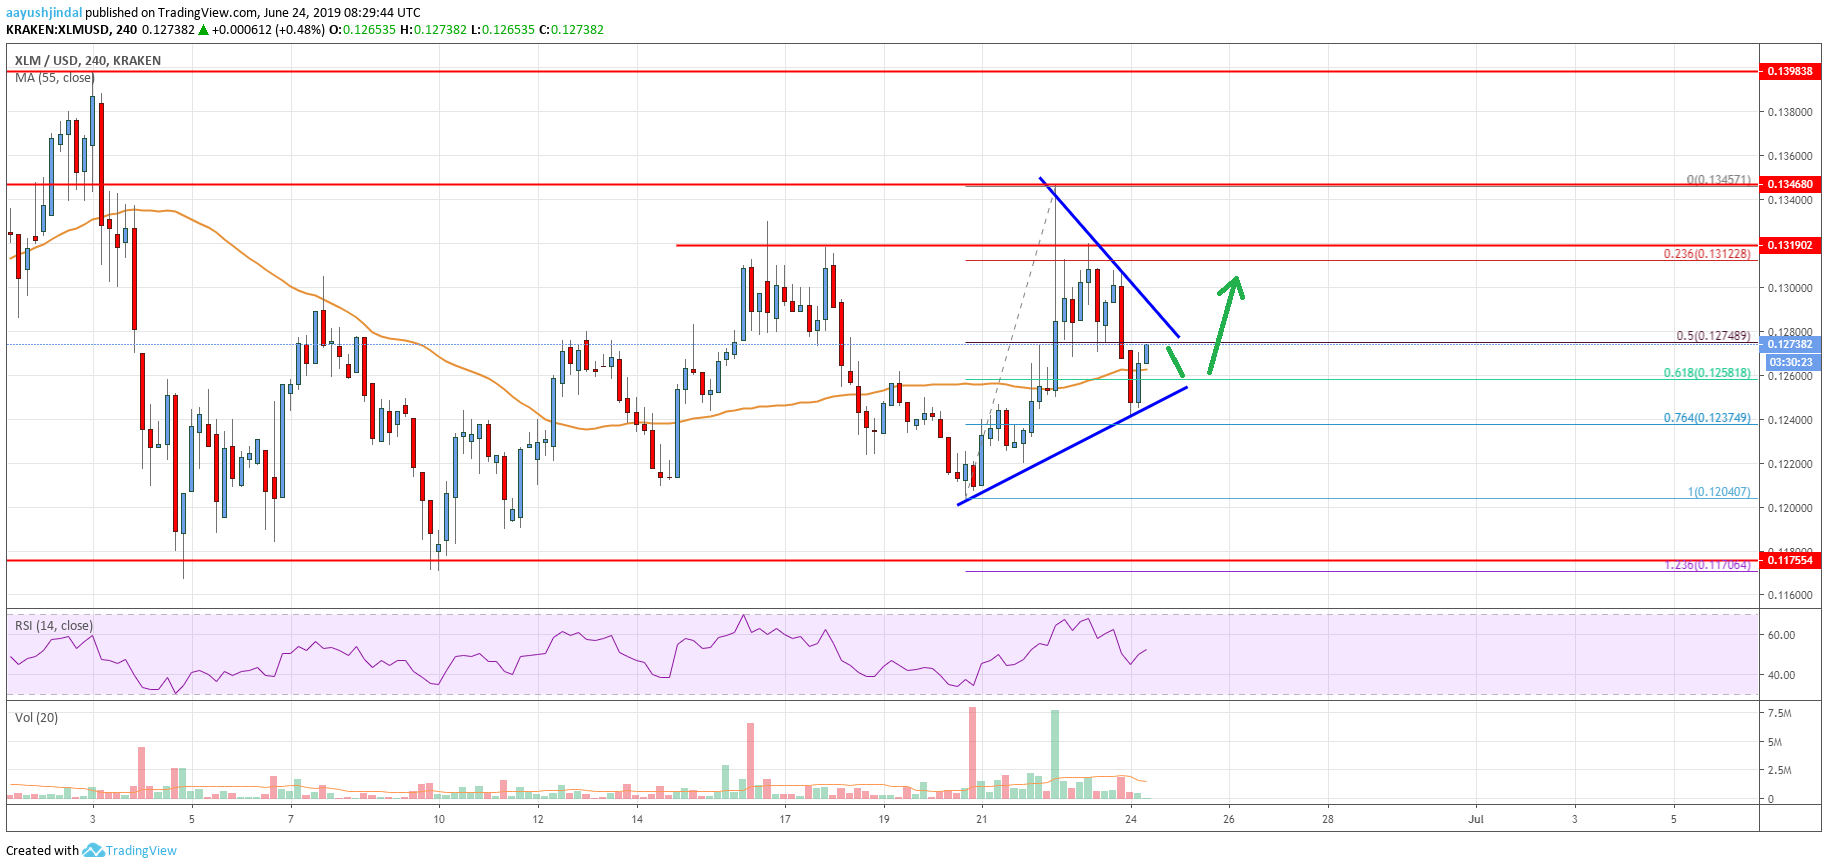
This past week, stellar lumen price gained traction above the $0.1300 resistance against the US Dollar. The XLM/USD pair even broke the $0.1320 resistance and settled above the 55 simple moving average (4-hours). However, the price failed to clear the $0.1345 and $0.1350 resistance levels. A swing high was formed near $0.1345 and the price recently corrected lower.
It broke the $0.1300 support to move away from the pivot levels. The price even traded below the 50% Fibonacci retracement level of the upward move from the $0.1204 low to $0.1345 high. Finally, there was a spike below the $0.1250 support, the 55 simple moving average (4-hours), and the 61.8% Fibonacci retracement level of the upward move from the $0.1204 low to $0.1345 high.
However, the $0.1244 level acted as a support. Moreover, the 76.4% Fibonacci retracement level of the upward move from the $0.1204 low to $0.1345 high also provided support. At the moment, the price is moving higher and is currently stable above $0.1250. Besides, there is a short term breakout pattern forming with resistance at $0.1280 on the 4-hours chart.
Therefore, it seems like the price is forming a breakout pattern either above $0.1300 or below $0.1250. If there is an upside break, the price could retest the $0.1320 or $0.1350 resistance. On the downside, the main support is near $0.1250, below which the price may slide towards $0.1180.

The chart indicates that XLM price is trading with a positive bias above the $0.1250 level. If there is a clear break above the $0.1300 and $0.1320 levels, the price is likely to gain bullish momentum. In the mentioned scenario, the price may even climb further above the $0.1400 and $0.1420 levels. The next key resistance is near $0.1500.
Technical Indicators
4 hours MACD – The MACD for XLM/USD is slowly moving in the bullish zone, with a positive bias.
4 hours RSI – The RSI for XLM/USD is currently just near the 50 level, with a positive angle.
Key Support Levels – $0.1250 and $0.1220.
Key Resistance Levels – $0.1300, $0.1320 and $0.1350.


Leave a Reply
You must be logged in to post a comment.