- Stellar lumen price found a strong support near $0.1175 and recently climbed higher against the US Dollar.
- XLM price broke a few important resistance levels near the $0.1250 and $0.1300 levels.
- There was a break above a crucial bearish trend line with resistance at $0.1245 on the 4-hours chart (data feed via Kraken).
- The pair is currently trading in a positive zone and it may continue to climb towards $0.1500 or $0.1600.
Stellar lumen price is gaining strength above $0.1300 against the US Dollar. XLM price remains in a solid uptrend and it may soon revisit the $0.1550 and $0.1600 levels.
Stellar Lumen Price Analysis (XLM to USD)
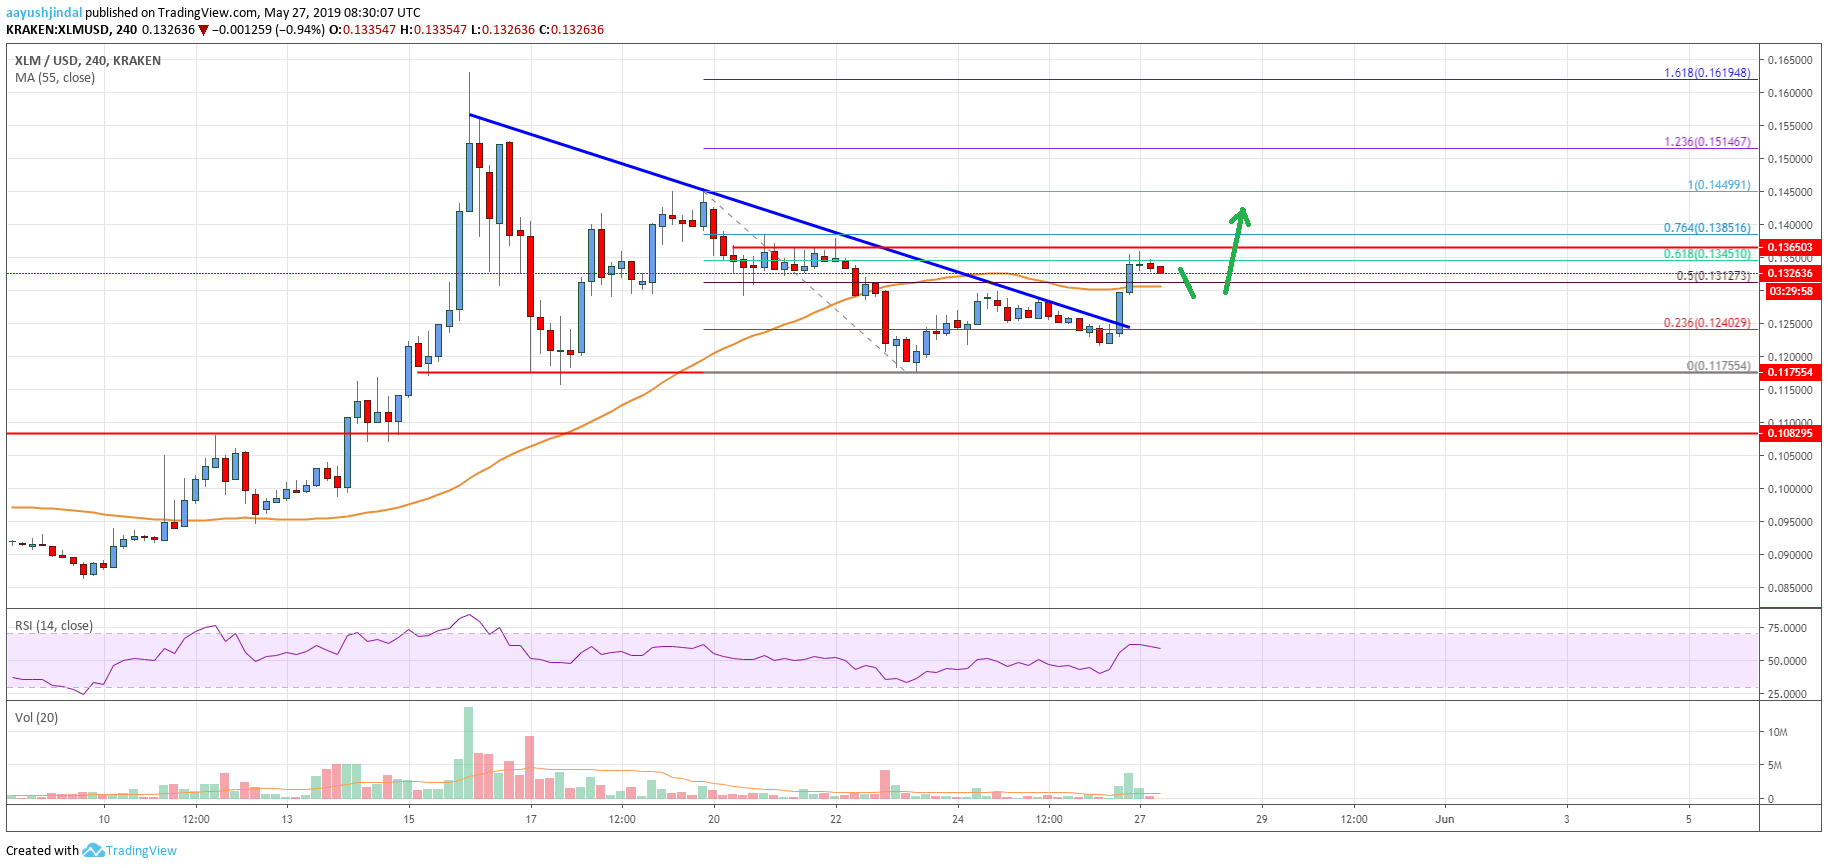
This past week, stellar lumen price corrected lower below the $0.1250 support against the US Dollar. The XLM/USD pair even broke the $0.1200 level and the 55 simple moving average (4-hours). However, the previous support near $0.1175 once again acted as a strong support. The price formed a support base and recently climbed above the $0.1200 and $0.1250 resistance levels. There was also a close above $0.1250 and the 55 simple moving average (4-hours).
Moreover, there was a break above a crucial bearish trend line with resistance at $0.1245 on the 4-hours chart. The pair cleared the 50% Fibonacci retracement level of the last decline from the $0.1449 high to $0.1175 low. The current momentum was positive since there was a break above the $0.1300 level. The price is currently struggling to surpass the $0.1350 and $0.1360 levels. The 61.8% Fibonacci retracement level of the last decline from the $0.1449 high to $0.1175 low is also near the $0.1360 level.
A successful break above the $0.1360 resistance is likely to open the doors for more gains above the $0.1400 and $0.1410 levels. The next key resistance is near $0.1450m, followed by $0.1510. It coincides with the 1.236 Fib extension level of the last decline from the $0.1449 high to $0.1175 low. Conversely, if there is a downside correction, the price might find support near $0.1300 and the 55 SMA. If there are additional losses, the $0.1250 support may perhaps act as a strong buy zone.

The chart indicates that XLM price is gaining strength above the $0.1300 level. Having said that, the price must break the $0.1360 resistance area to start the next upward move. The main targets this week for the bulls could be $0.1450m, $0.1500 and $0.1510.
Technical Indicators
4 hours MACD – The MACD for XLM/USD is currently gaining strength in the bullish zone.
4 hours RSI – The RSI for XLM/USD is currently well above the 50 level, with a positive bias.
Key Support Levels – $0.1300 and $0.1250.
Key Resistance Levels – $0.1360, $0.1450 and $0.1510.


Leave a Reply
You must be logged in to post a comment.