- Stellar lumen price started a nice upward move from the $0.0863 swing low against the US Dollar.
- XLM price climbed above the $0.0950 and $0.1000 resistance levels before correcting lower.
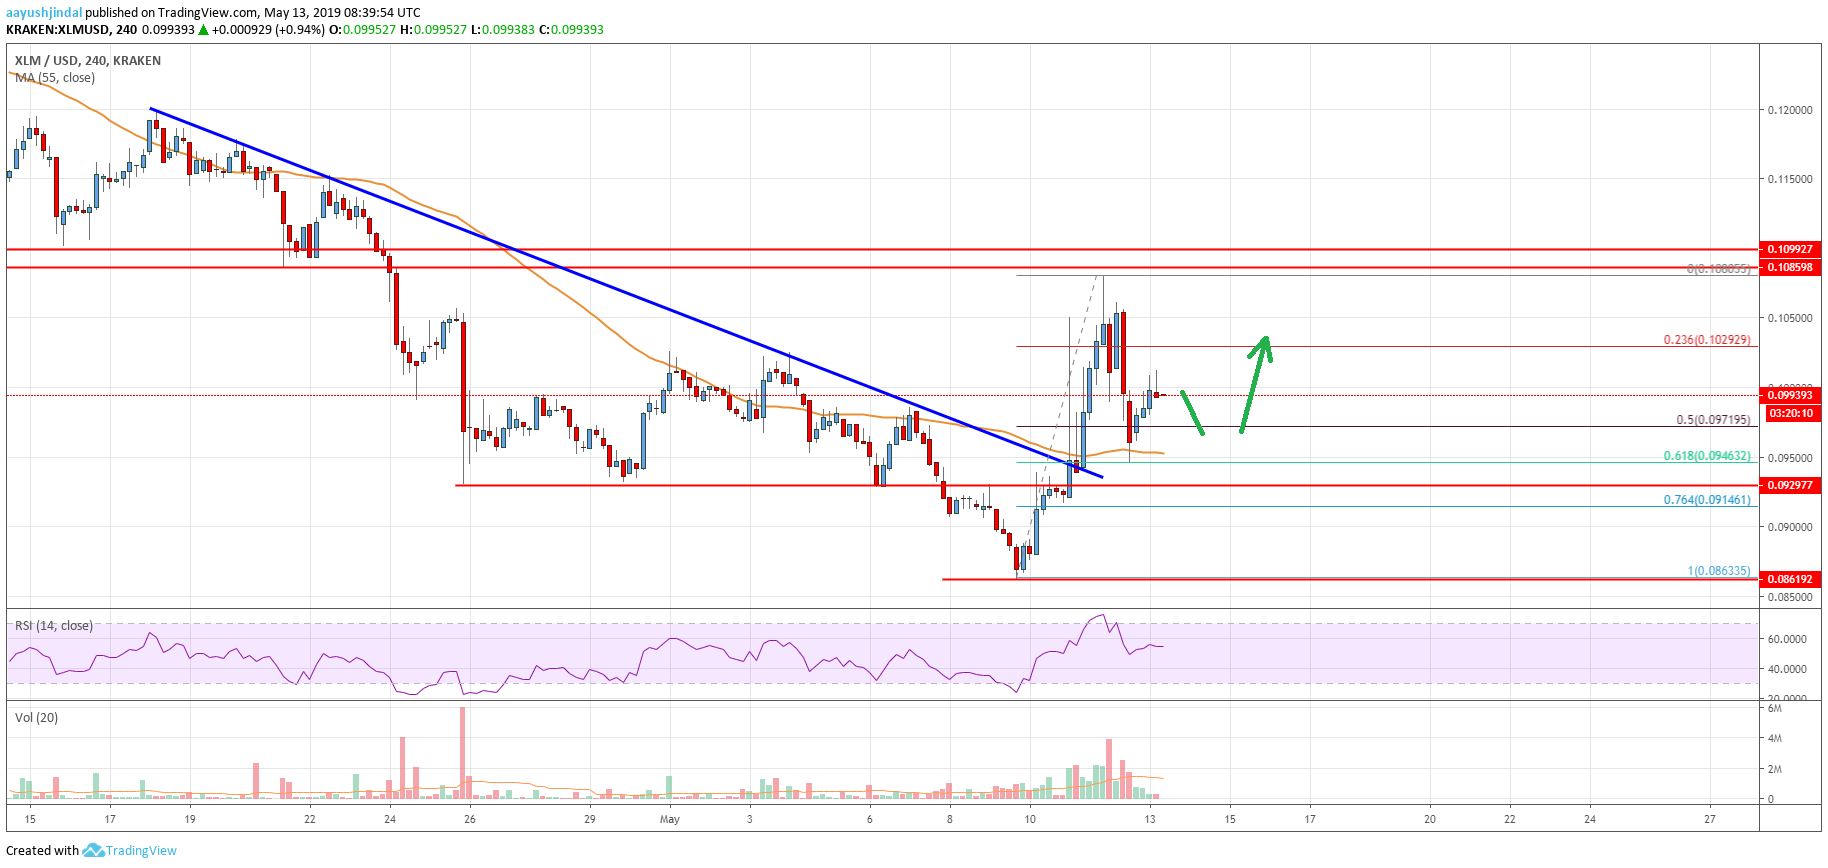
- There was a clear break above a crucial bearish trend line with resistance at $0.0950 on the 4-hours chart (data feed via Kraken).
- The pair corrected lower recently, it remains well supported near the $0.0950 area.
Stellar lumen price started a strong recovery above $0.0950 and $0.1000 against the US Dollar. XLM price remains supported and it could move higher towards $0.1050 and $0.1100.
Stellar Lumen Price Analysis (XLM to USD)
This past week, stellar lumen price gained traction after bitcoin’s rise against the US Dollar. Earlier, the XLM/USD pair declined heavily below the $0.1000 and $0.0900 support levels. A swing low was formed at $0.0863 before the price started an upward move. There was a steady rise above the $0.0900 and $0.0920 resistance levels. The bulls gained traction above the $0.0950 resistance and the 55 simple moving average (4-hours).
During the rise, there was a clear break above a crucial bearish trend line with resistance at $0.0950 on the 4-hours chart. The pair rallied above the $0.1000 and $0.1020 resistance levels. The price even surpassed the $0.1050 level and traded as high as $0.1080. It recently corrected lower below $0.1020 and the 23.6% Fibonacci retracement level of the last wave from the $0.0863 low to $0.1080 high. The correction was such that the price spiked below $0.1000, and the 50% Fibonacci retracement level of the last wave from the $0.0863 low to $0.1080 high.
However, the $0.0950 support and the 55 SMA acted as a strong buy zone. Besides, the price rebounded after tagging the 61.8% Fibonacci retracement level of the last wave from the $0.0863 low to $0.1080 high. The price is currently trading just below the $0.1000 level and it seems like there could be a strong rally above the $0.1000 resistance. The next key resistance is at $0.1028, above which the price may revisit the $0.1080 swing high.

The chart indicates that XLM price is trading nicely with a positive bias above the $0.0950 level and the 55 SMA. Therefore, there are high chances of a fresh increase above the $0.1000 and $0.1028 resistance levels. On the other hand, a close below the $0.0950 support level might trigger a strong decline towards $0.0850.
Technical Indicators
4 hours MACD – The MACD for XLM/USD is slowly moving in the bullish zone.
4 hours RSI – The RSI for XLM/USD is currently well above the 50 level and it could test 65.
Key Support Levels – $0.0950 and $0.0900.
Key Resistance Levels – $0.1000, $0.1028 and $0.1050.


Leave a Reply
You must be logged in to post a comment.