- Ripple price rallied sharply after it formed a support base above $0.4200 against the US dollar.
- The price surged above the $0.5050 level before it started a downside correction.
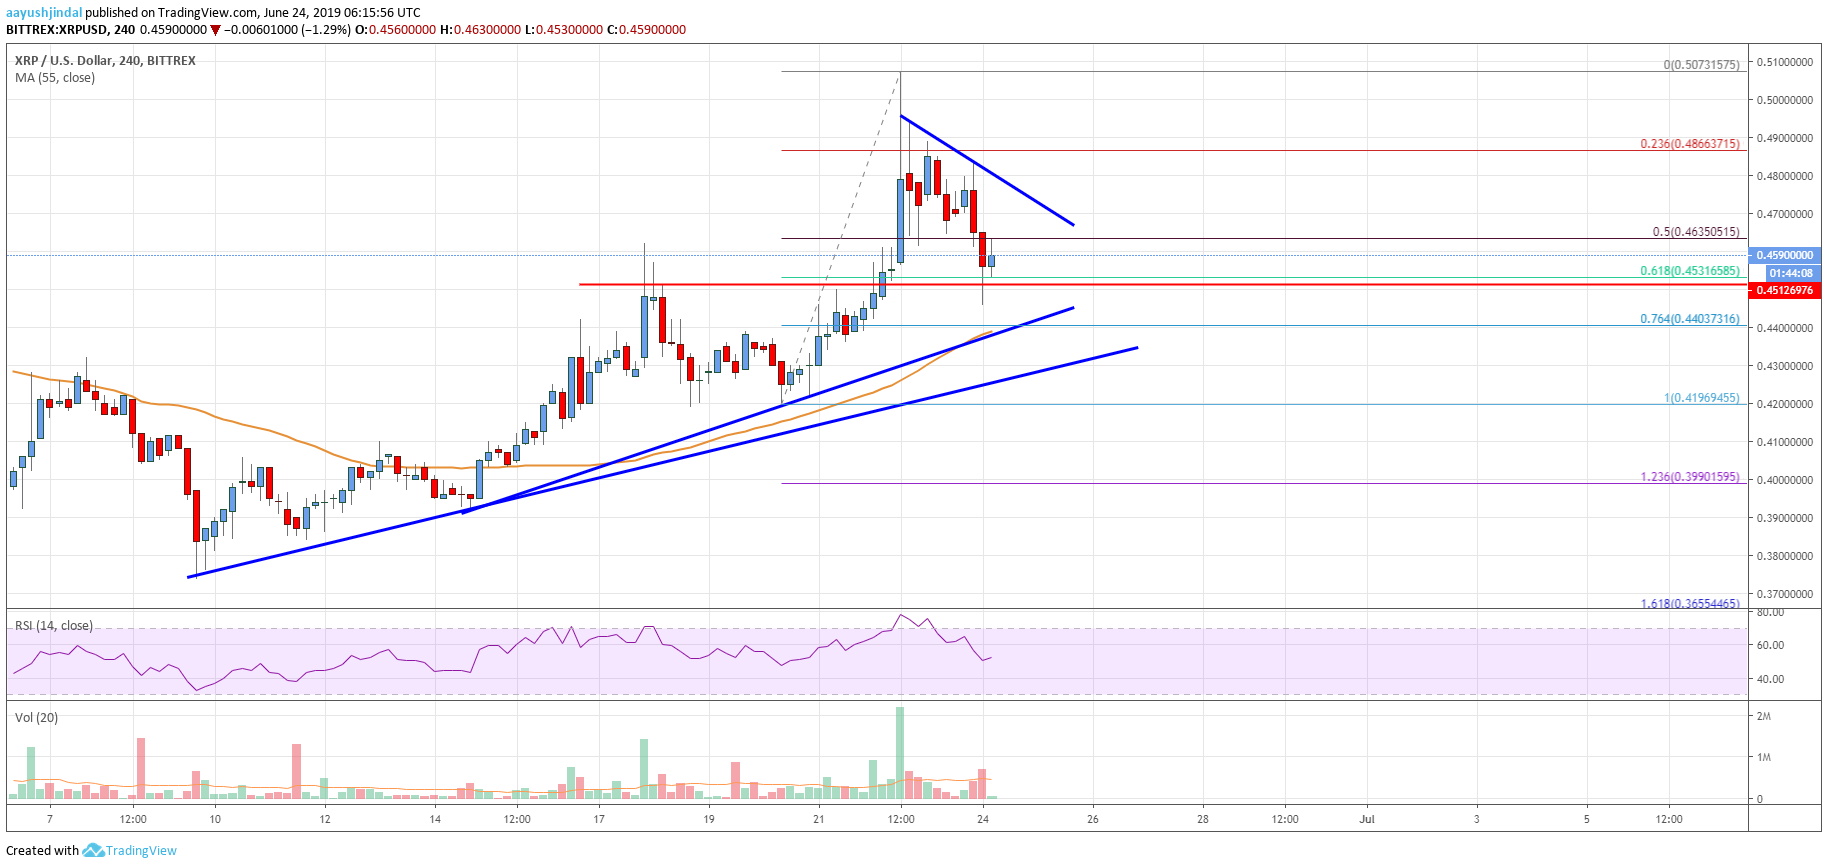
- There are two bullish trend line forming with support near $0.4420 and $0.4300 on the 4-hours chart of the XRP/USD pair (data source from Bittrex).
- The price is currently holding key supports and it could bounce back above $0.4800 in the near term.
Ripple price dived from well above $0.5000 against the US Dollar. However, XRP is holding the key $0.4540 support and it could start a fresh increase above $0.4800.
Ripple Price Analysis
This past week, there was a nasty upward move in bitcoin, Ethereum, bitcoin cash, ADA and ripple against the US Dollar. The XRP/USD pair formed a strong support near the $0.4200 level before rallying above $0.4500. The price gained momentum above $0.4700 and the 55 simple moving average (4-hours). Finally, there was a break above the $0.5000 barrier and the price traded to a new 2019 high at $0.5073.
Later, the price struggled to continue higher and declined sharply below $0.5000. It broke the $0.4850 support area to enter a short term bearish zone. There was even a break below the 50% Fib retracement level of the last wave from the $0.4196 low to $0.5073 high. However, the $0.4450 and $0.4500 levels are acting as supports. The price is still holding the 61.8% Fib retracement level of the last wave from the $0.4196 low to $0.5073 high.
Moreover, there are two bullish trend line forming with support near $0.4420 and $0.4300 on the 4-hours chart of the XRP/USD pair. If there is a downside break below $0.4300, both trend lines, and the 55 simple moving average (4-hours), ripple price could move into a bearish zone.
The next key support is near the $0.4000 level. On the upside, an initial resistance is near the $0.4700 level. There is also a connecting bearish trend line forming with resistance at $0.4720 on the same chart. The main resistance is near $0.4800. If there is a successful break above the trend line and $0.4800, the price could start a fresh increase in the near term.

Looking at the chart, ripple price is clearly holding a couple of important supports near $0.4300. As long as the price is above $0.4300 and $0.4200, it remains in an uptrend.
Technical indicators
4 hours MACD – The MACD for XRP/USD is slowly losing momentum in the bearish zone.
4 hours RSI (Relative Strength Index) – The RSI for XRP/USD is currently just above the 50 level, with positive signs.
Key Support Levels – $0.4420, $0.4300 and $0.4200.
Key Resistance Levels – $0.4700 and $0.4800.


Leave a Reply
You must be logged in to post a comment.